
Outliers and Regression Line
Loading the math board and drawing, please wait…
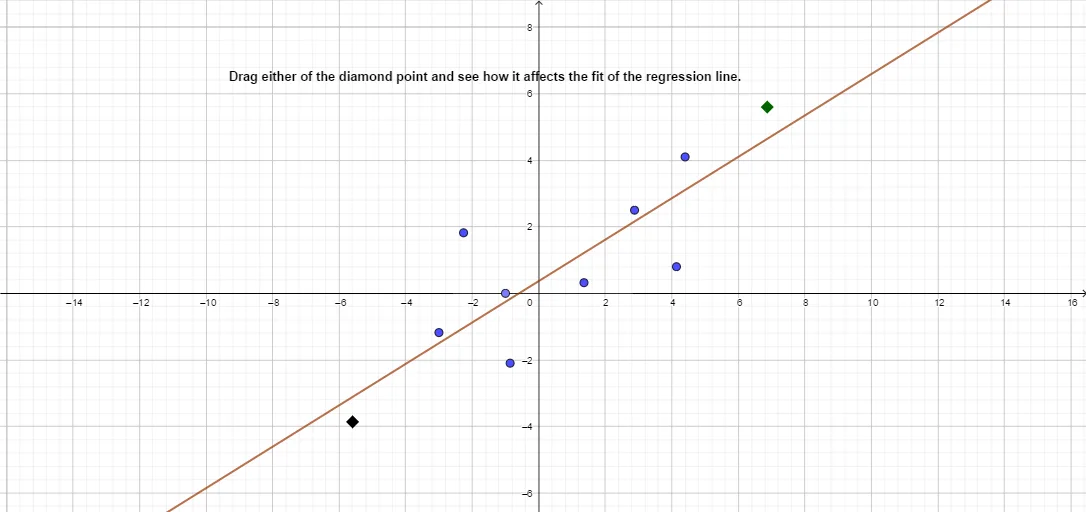
This example demonstrates how to display data points, outliers, and a fitted regression line in a coordinate system. Core math concepts include linear regression, outlier identification, and coordinate geometry. Construction involves commands like Point and FitLineY, using objects A to J and text1. Suitable for high school mathematics teaching, focusing on data analysis and linear regression basics.
GeoGebra Commands & Parameters
Point(xAxis) → JFitLineY({A, B, C, D, E, F, G, H, I, J}) → f