
Scatter Graphs & Line of Best Fit
Loading the math board and drawing, please wait…
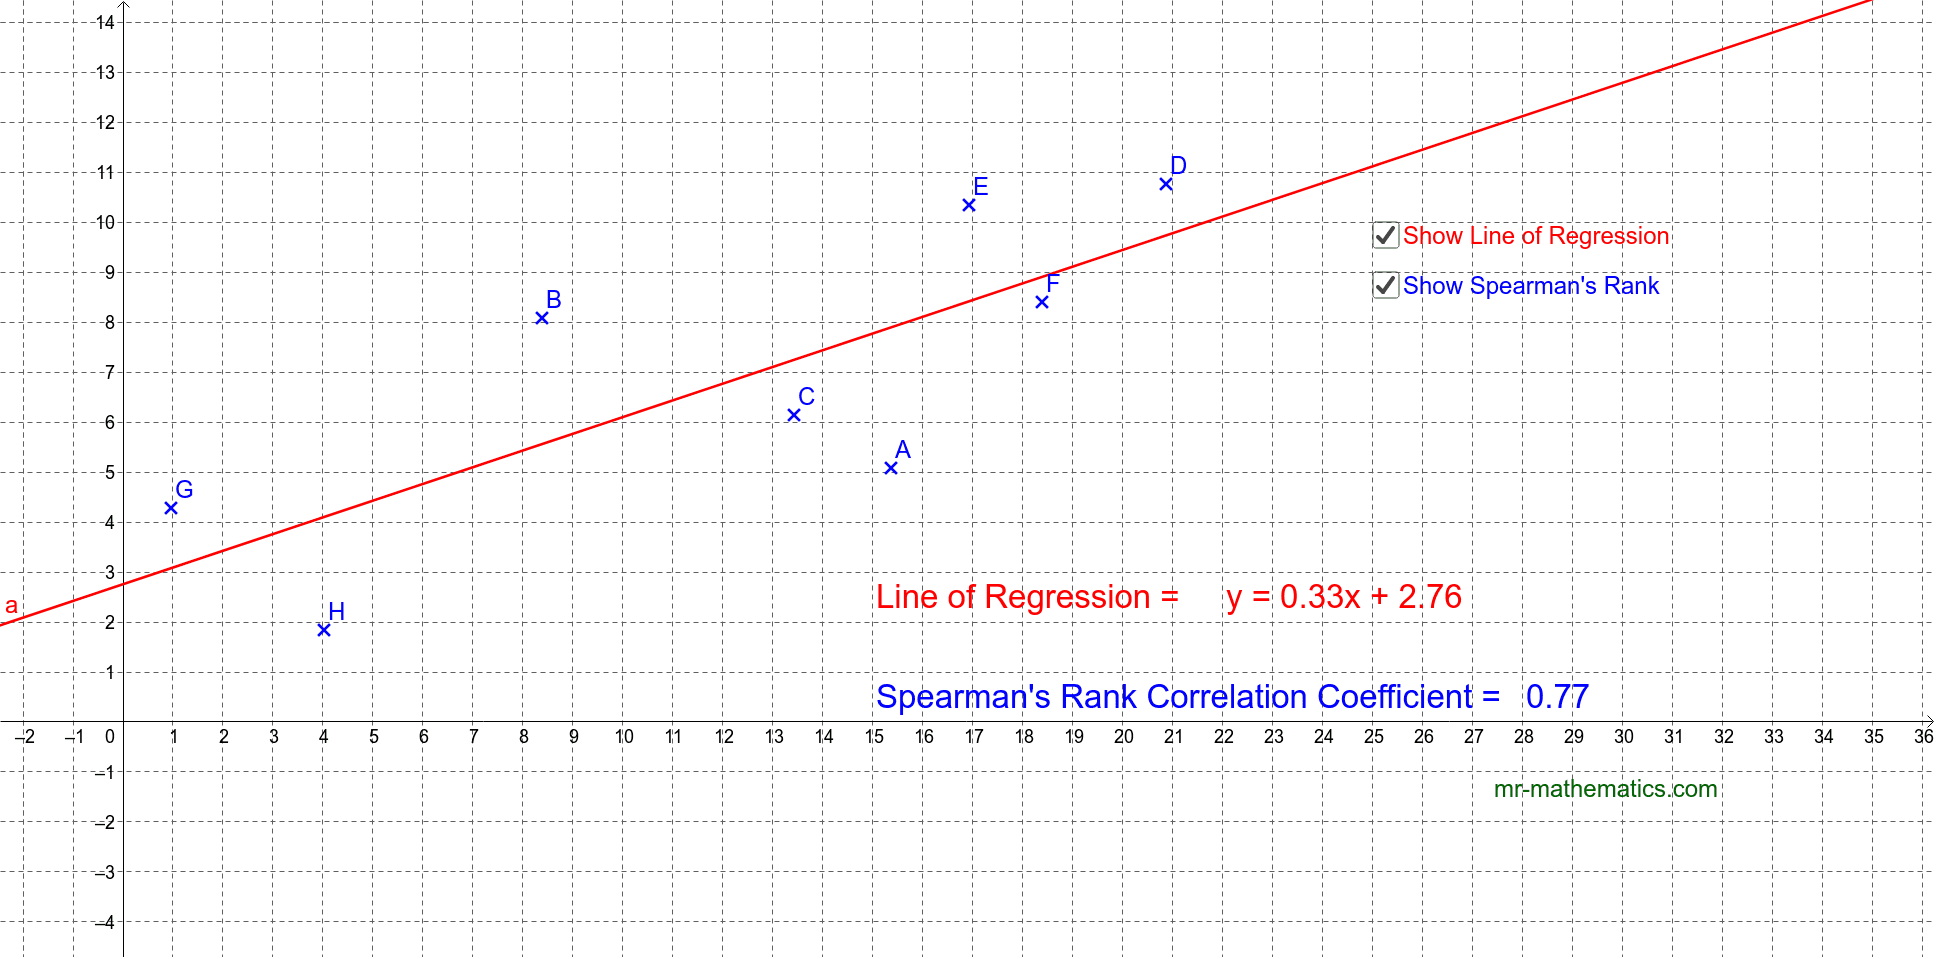
This example demonstrates the relationship between scatter graphs and the line of best fit by dragging coordinates. Key mathematical concepts include correlation and coordinate geometry. It utilizes GeoGebra commands such as FitLineY and PMCC, suitable for middle school mathematics education.
GeoGebra Commands & Parameters
FitLineY(List1) → aPMCC(List1) → b
AI Drawing Prompt Reference
Create a scatter plot showing the distribution of data points, then fit a line of best fit through these points and label its equation, also calculate and display the correlation coefficient between the data points, the entire graph is used to demonstrate the relationship between scatter plots and lines of best fit as well as the concept of correlation coefficients.
The prompt above was compiled from the original drawing commands and is for reference only.