
Sampling Distribution of the Sample Mean by Hermiod
Loading the math board and drawing, please wait…
In collections
Statistical Applets
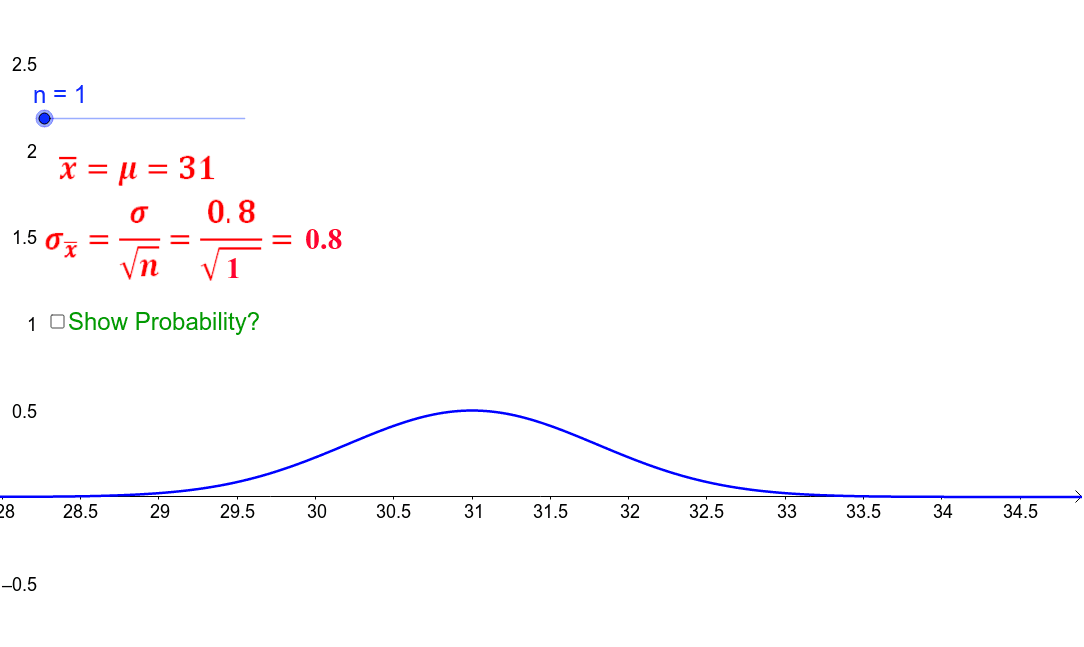
This example demonstrates how changing the sample size affects the mean of a sample from a normal distribution, including setting an upper-tail probability. Key math concepts include sampling distribution, sample mean, normal distribution, and probability & statistics. It is constructed using GeoGebra commands like IntegralBetween and objects such as n, e, μ, σ, sig, f, pic1, text_n, text_s, pic2, pic4, int, text1, p. Suitable for high school and above learners to understand basic principles of statistical inference.
GeoGebra Commands & Parameters
IntegralBetween(f, 0, 31.56, 99) → int
AI Drawing Prompt Reference
Draw a sampling distribution graph showing the mean of a sample from a normal distribution, including an integral area from 0 to 31.56 to represent the upper-tail probability, and display the effects of sample size, mean, and standard deviation on the distribution, suitable for high school and above learners to understand basic principles of statistical inference.
The prompt above was compiled from the original drawing commands and is for reference only.