
t Distribution and Standard Normal Distribution
Loading the math board and drawing, please wait…
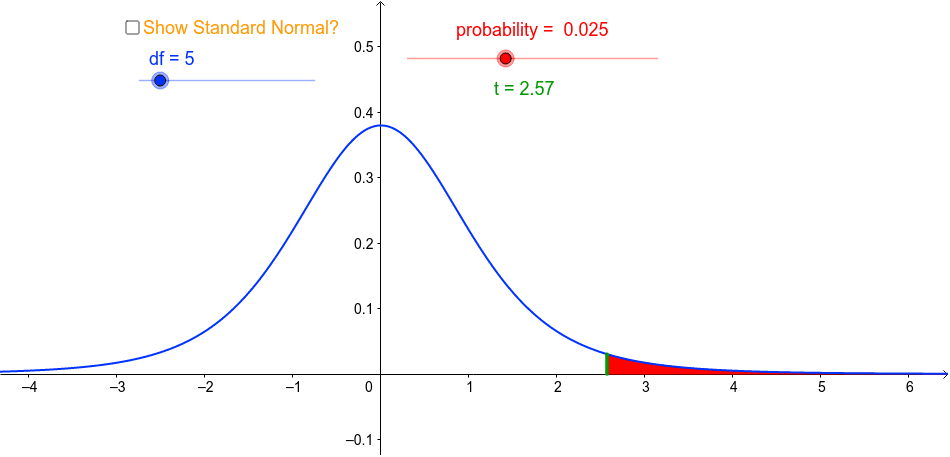
This example demonstrates the relationship between the t-distribution and the standard normal distribution by adjusting the degrees of freedom and observing changes in upper-tail probabilities. Key mathematical concepts include the t-distribution, standard normal distribution, degrees of freedom, and probability calculations. Construction involves GeoGebra commands such as Segment and IntegralBetween. Suitable for high school or college students in probability and statistics courses to understand the properties of the t-distribution and its applications in statistical inference.
GeoGebra Commands & Parameters
Segment(A, B) → lineIntegralBetween(f, 0, t, 999) → integral
AI Drawing Prompt Reference
Draw the t-distribution and standard normal distribution curves. Adjust the degrees of freedom to observe changes in the upper-tail probability. First, draw a line segment to represent the t-distribution curve, then shade the upper-tail probability area, and finally draw the standard normal distribution curve to compare the two.
The prompt above was compiled from the original drawing commands and is for reference only.