
Exploring Fractions of Quantities
Loading the math board and drawing, please wait…
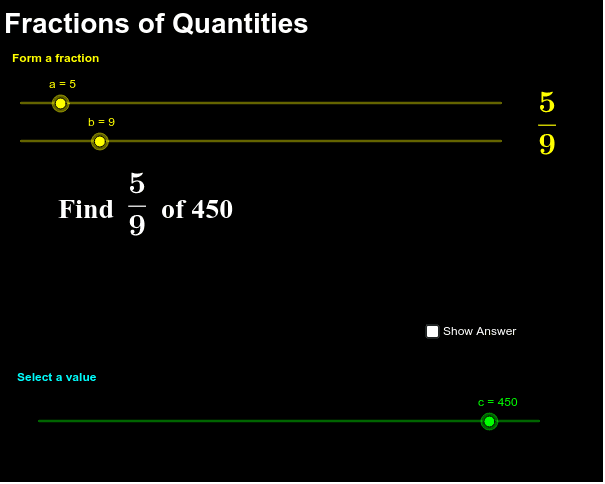
This example demonstrates how to explore fractions applied to different quantities using interactive tools. It involves core math concepts like fractions, continuity, binomial distribution, numbers, geometric mean, and functions. The construction uses GeoGebra commands/objects: text1, text2, a, b, c, text3, text4, text5, ans, text6, d. Suitable for high school mathematics teaching or self-learning to understand fraction operations and statistical distributions.
GeoGebra Commands & Parameters
Numeric a(5.0)Numeric b(9.0)Numeric c(450.0)a / b * cBoolean d(false)
AI Drawing Prompt Reference
Create an interactive educational diagram illustrating fractions applied to different quantities. Place a slider in the center to adjust a numeric parameter. Display three numbers: 5, 9, and 450. Compute the result of dividing 5 by 9 and multiplying by 450, showing the answer prominently. Include a toggle switch to show or hide additional explanatory text. The layout should be clean and suitable for high school math teaching, connecting fraction operations with statistical distributions.
The prompt above was compiled from the original drawing commands and is for reference only.