
Sampling Distribution of the Mean by Steve Phelps
Loading the math board and drawing, please wait…
In collections
Statistics Demonstrations
Statistics Demonstrations
Statistics Demonstrations
Statistics 2
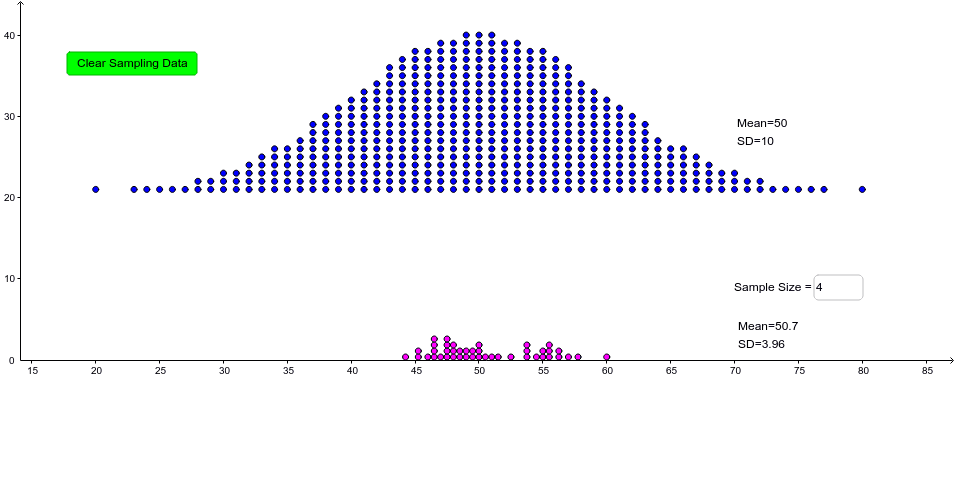
This example demonstrates repeatedly taking samples (with replacement) from a population of approximately 500 normally distributed data values and plotting the distribution of sample means. Key mathematical concepts include arithmetic mean, normal distribution, and probability & statistics. GeoGebra commands used include Sequence, Mean, Textfield, DotPlot, and Translate. Suitable for high school statistics courses.
GeoGebra Commands & Parameters
Sequence(RandomElement[datatags], a, 1, n) → list1Mean(list1) → aTextfield(n) → inputBox1DotPlot(data, true, 1) → list2Translate(DotPlot[datatags], (0, 20)) → list3