
Sample Size Variation Exploration
Loading the math board and drawing, please wait…
In collections
Sample Size
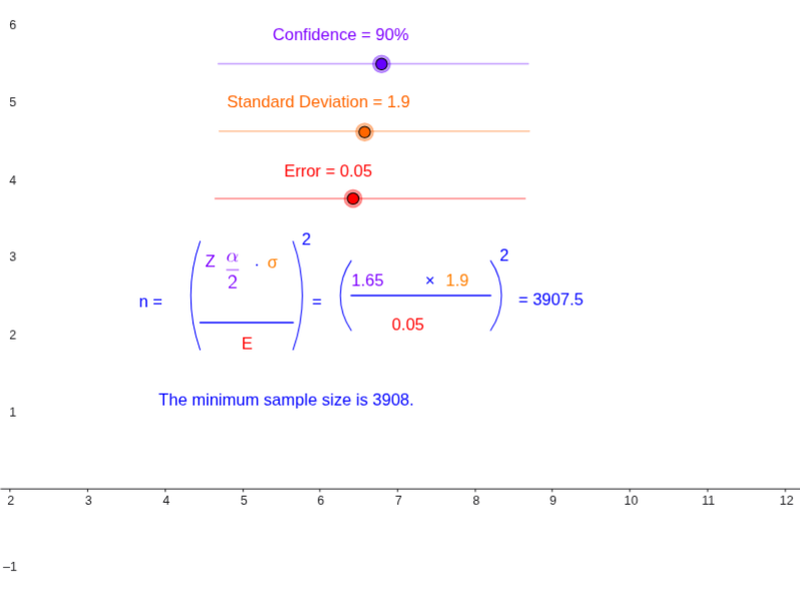
This GeoGebra applet demonstrates how the minimum sample size needed to estimate the population mean changes as the confidence level varies. It involves core statistical concepts such as error, standard deviation, and confidence intervals. By adjusting the confidence level, students can observe changes in sample size. The applet uses GeoGebra commands like Segment and CircumcircleArc for construction. Suitable for statistics courses.
GeoGebra Commands & Parameters
Segment(LE1, RE1) → DvBr1CircumcircleArc(LT1, LC1, LB1) → LfPr1CircumcircleArc(RT1, RC1, RB1) → RtPr1Segment(RE2, LE2) → DvBr2CircumcircleArc(LT2, LC2, LB2) → LfPr2CircumcircleArc(RT2, RC2, RB2) → RtPr2
AI Drawing Prompt Reference
Create a graph showing how the required sample size varies with different confidence levels. First, draw two horizontal segments DvBr1 and DvBr2, then draw two arcs LfPr1 and RtPr1 around LT1, LC1, LB1 and RT1, RC1, RB1, and two arcs LfPr2 and RtPr2 around LT2, LC2, LB2 and RT2, RC2, RB2.
The prompt above was compiled from the original drawing commands and is for reference only.