
Sample Means Distribution: Repeated Sampling and Histogram
Loading the math board and drawing, please wait…
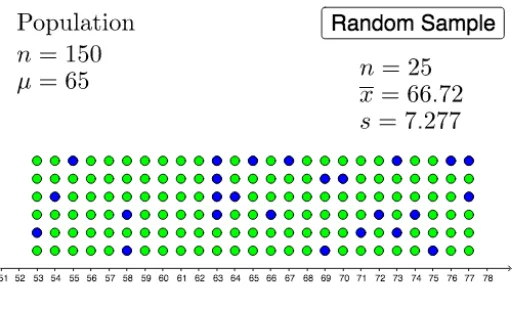
This GeoGebra example dynamically demonstrates the process of repeatedly drawing samples from a population and computing their means, visually illustrating the distribution of sample means. The core mathematical concepts involve sampling distributions, the Central Limit Theorem, and the relationship between sample means and the population mean. Construction highlights include using the DotPlot command to create dot plots, the Sample command to generate random samples, and mean, MeanX, and SampleSDX to calculate sample means and standard deviations. Numerous objects (e.g., A150 to A111) store each sampling result, ultimately forming a histogram of sample means. This resource is suitable for introductory statistics courses at the high school or college level, helping students grasp sampling error and how the distribution of sample means changes with sample size, and can also be used to explore the effect of different sample sizes on the shape of the distribution.
GeoGebra Commands & Parameters
DotPlot(list1) → list2Sample(list2, 25 + b, false) → list3mean(list1) → aMeanX(list3) → cSampleSDX(list3) → d
AI Drawing Prompt Reference
Create a statistical simulation graphic showing a dot plot of original data, then use a slider to control sample size. Repeatedly draw random samples from the data, compute each sample mean, and accumulate these means into a dot plot or histogram. The graphic should display the original data distribution, the sequence of sample means, and a growing histogram of sample means, with markers for the population mean and current sample mean to illustrate sampling error and the central limit theorem.
The prompt above was compiled from the original drawing commands and is for reference only.