
Rotation of a function about x-axis (volume of revolution)
Loading the math board and drawing, please wait…
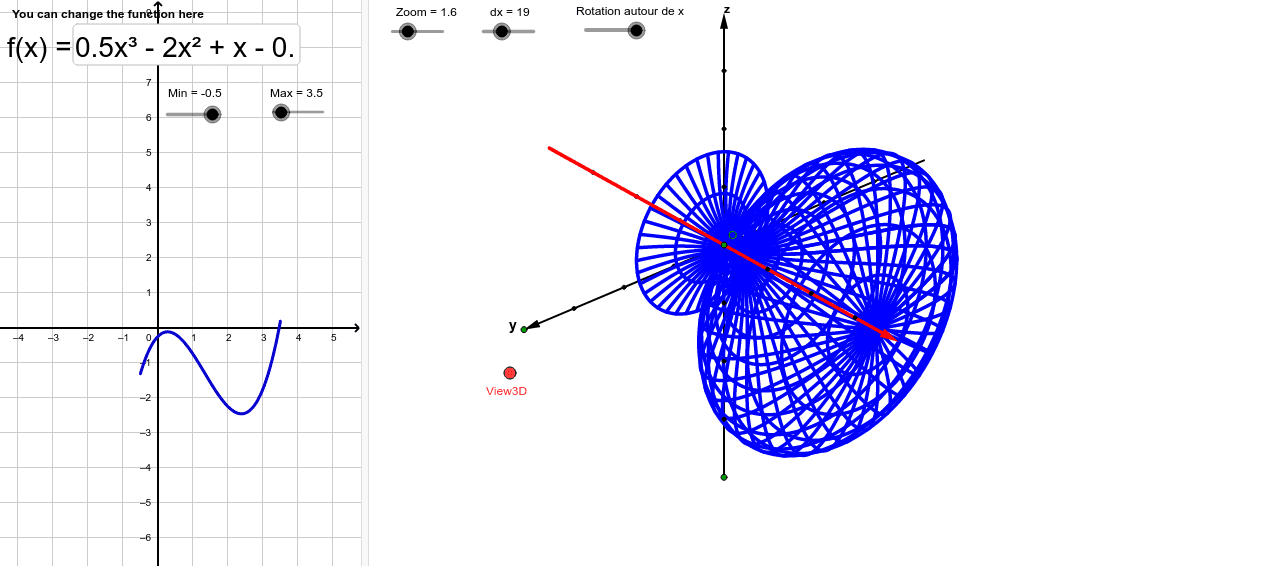
This example demonstrates the 3D visualization and volume calculation of a solid of revolution formed by rotating a function around the x-axis. Key mathematical concepts include function graphs, solids of revolution, volume computation, and integral applications in calculus. The construction leverages GeoGebra commands and objects such as Vector, OrthogonalLine, Translate, Mirror, Segment, Point, Line, Sequence, Intersect, Function, and Textfield. It is suitable for high school and above students studying calculus, solid geometry, and function transformations to understand the geometric meaning and calculation of volumes of revolution.
GeoGebra Commands & Parameters
Vector(B_1, X) → u_1Vector(B_1, Z) → wOrthogonalLine(View3D, yAxis) → aOrthogonalLine(View3D, xAxis) → bVector(B_1, Y) → vTranslate(O, Vector[u * u_1]) → O'_1Translate(O, Vector[u * v]) → O'_2Vector(O, O'_2) → zVector(O, O'_1) → dTranslate(O, Vector[u * w]) → O'_3Vector(O, O'_3) → eMirror(O'_1, O) → GMirror(O, O'_2) → O'_4Translate(O, Vector[-u * w]) → O'_5Translate(O, Vector[-u * v]) → O'Segment(O, O'_5) → iSegment(O, O') → jPoint(xAxis) → HLine(H, yAxis) → lPoint(xAxis) → ISequence(O + i * v, i, -3, 3) → liste5Sequence(O + i * w, i, -3, 3) → liste6Sequence(O + i * u_1, i, -3, 3) → liste7Intersect(xAxis, yAxis) → JPoint(yAxis) → KPoint(yAxis) → LVector(K, L) → qPoint(xAxis) → MVector(I, M) → rSequence((x(J) + i, y(J)), i, -3, 3) → liste8Sequence((x(J), y(J) + i), i, -3, 3) → liste9Function(f, Min, Max) → pMirror(O'_1, O) → NSegment(N, O) → n_1Sequence(CurveCartesian[x(O + t * u_1 + f(t) * cos(s) * v - f(t) * sin(s) * w), y(O + t * u_1 + f(t) * cos(s) * v - f(t) * sin(s) * w), t, Min, Max], s, 0, 2 * 3.141592653589793 * Rot / 24, 3.141592653589793 / dx) → liste10Sequence(CurveCartesian[x(O + t * u_1 + f(t) * cos(s) * v - f(t) * sin(s) * w), y(O + t * u_1 + f(t) * cos(s) * v - f(t) * sin(s) * w), s, 0, 2 * 3.141592653589793 * m / 24], t, Min, Max, (Max - Min) / dx) → liste11Textfield(f) → ChampTexte1
AI Drawing Prompt Reference
Visualize a solid of revolution formed by rotating a function around the x-axis, highlighting its 3D shape and volume calculation. Start by drawing the x, y, and z axes, then create a vector pointing along the x-axis and use it to generate a series of parallel lines. Next, sketch the function graph and its rotated surface, distinguishing different parts of the solid with varying colors. Finally, label the function expression and the volume calculation formula to illustrate its mathematical significance.
The prompt above was compiled from the original drawing commands and is for reference only.