
Root Function Transformation Graph 4: Visualizing Shifts and Scaling
Loading the math board and drawing, please wait…
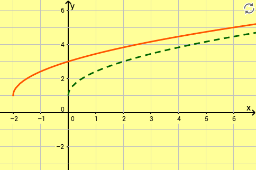
①This example demonstrates how the graph of a root function (e.g., square root or cube root) changes under transformations such as translation and scaling, allowing users to dynamically adjust parameters to observe the geometric effects on the curve. ②Core mathematical concepts include domain and range of root functions, horizontal/vertical translations, vertical/horizontal stretches or compressions, and reflections, along with the relationship between algebraic expressions and their graphical representations. ③Construction highlights: Based on the summary, the example uses objects f and g, where f is the original root function and g is the transformed function. GeoGebra's algebra and graphics views are linked, with sliders or input parameters controlling transformation coefficients to update the graph in real time. ④This is suitable for high school students learning function transformations, as well as for pre-calculus review, helping build intuitive understanding of how transformations affect graphs and preparing for more complex functions like exponential or logarithmic ones.
GeoGebra Commands & Parameters
f(x) = sqrt((2 * x)) + 1g(x) = sqrt((2 * (x + 2))) + 1
AI Drawing Prompt Reference
Draw the graph of a root function y=√(2x)+1 first, then apply transformations to create a new function y=√(2(x+2))+1. Observe how changes in parameters affect the graph and understand transformations such as translation, scaling, and reflection.
The prompt above was compiled from the original drawing commands and is for reference only.