
Rolling Two Dice Simulation
Loading the math board and drawing, please wait…
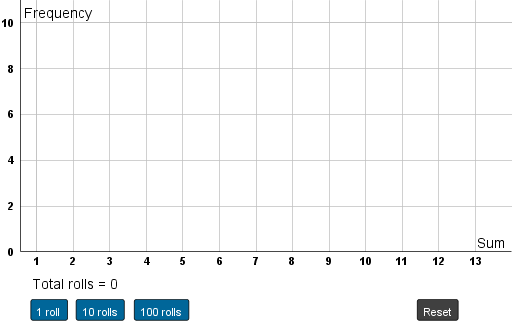
This example demonstrates the statistical outcomes and distribution when rolling two six-sided dice. It involves core math concepts like Probability & Statistics, data distribution, and frequency analysis. Constructed using GeoGebra commands/objects such as Sequence, BarChart, and If. Suitable for high school probability statistics teaching or math clubs.
GeoGebra Commands & Parameters
Sequence(Random[1, 6], k, 1, 100) → die1list, {4, 6, 6, 4, 4, 5, 3, 3, 3, 6, 1, 5, 5, 1, 4, 3, 6, 6, 6, 5, 1, 6, 5, 1, 5, 1, 1, 2, 5, 6, 5, 3, 3, 2, 1, 3, 6, 3, 4, 2, 6, 1, 5, 6, 3, 6, 4, 2, 5, 5, 5, 2, 6, 5, 1, 4, 3, 5, 2, 3, 1, 5, 4, 6, 6, 1, 4, 5, 2, 1, 6, 5, 4, 5, 2, 3, 5, 6, 1, 4, 2, 1, 5, 1, 1, 4, 6, 3, 6, 1, 1, 2, 1, 2, 5, 1, 1, 6, 5, 5}Sequence(Random[1, 6], k, 1, 100) → die2list, {5, 6, 6, 5, 3, 1, 2, 1, 4, 1, 1, 2, 1, 1, 2, 6, 3, 1, 5, 4, 6, 1, 2, 3, 3, 5, 1, 4, 3, 6, 2, 2, 3, 4, 6, 2, 2, 6, 2, 2, 5, 1, 6, 5, 1, 6, 6, 5, 6, 2, 1, 4, 3, 3, 3, 2, 1, 4, 5, 4, 2, 3, 3, 2, 3, 1, 4, 3, 1, 1, 2, 2, 2, 3, 1, 3, 3, 1, 4, 1, 3, 6, 2, 4, 3, 3, 1, 3, 1, 2, 5, 4, 4, 1, 5, 5, 2, 2, 4, 5}Sequence(CountIf[x ≟ k, rolls], k, 2, 12) → frequencies, {0, 0, 0, 0, 0, 0, 0, 0, 0, 0, 0}Sequence(2, 12) → labelsBarChart(labels, frequencies) → aIf(Max[frequencies] < 10, 11, (Max[frequencies] * 1.08)) → maxSequence(sumlist(k), k, 91, 100) → last10, {6, 6, 5, 3, 10, 6, 3, 8, 9, 10}BarChart(labels, frequencies) → b
AI Drawing Prompt Reference
Create a visualization for the frequency distribution of rolling two six-sided dice. First generate two random sequences of length 100 with values from 1 to 6, representing the results of die 1 and die 2. Use the possible sums 2 through 12 as the x-axis categories. Compute how many times each sum occurs across the simulated rolls, producing a frequency array. Draw a bar chart using the sums as labels and the corresponding frequencies as bar heights, scaling the vertical extent based on the maximum frequency so all bars are clearly visible.
The prompt above was compiled from the original drawing commands and is for reference only.