
Rolling a Die Simulation
Loading the math board and drawing, please wait…
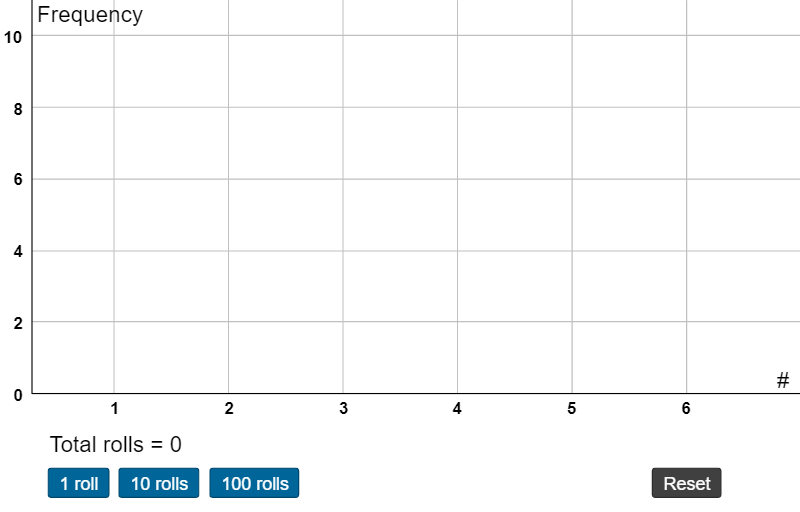
This applet simulates rolling a single 6-sided die to demonstrate basic concepts of probability and statistics. It uses commands like Sequence and BarChart in GeoGebra, suitable for middle school and above students.
GeoGebra Commands & Parameters
Sequence(Random[1, 6], k, 1, 100) → die1list, {5, 2, 6, 6, 1, 2, 5, 5, 4, 4, 5, 6, 2, 4, 4, 3, 6, 6, 2, 3, 2, 6, 1, 2, 1, 5, 2, 2, 2, 4, 5, 6, 6, 6, 1, 1, 5, 2, 5, 6, 1, 1, 2, 2, 4, 2, 5, 2, 6, 6, 1, 4, 4, 4, 5, 4, 2, 4, 5, 3, 2, 5, 2, 4, 3, 2, 1, 6, 2, 5, 5, 5, 4, 1, 5, 2, 4, 3, 6, 1, 5, 2, 3, 1, 3, 2, 2, 1, 1, 3, 6, 4, 3, 1, 6, 4, 4, 5, 6, 4}Sequence(Random[1, 6], k, 1, 100) → die2list, {4, 6, 1, 1, 5, 1, 1, 1, 1, 5, 3, 1, 1, 2, 2, 6, 5, 2, 2, 5, 1, 1, 1, 2, 5, 6, 1, 6, 3, 4, 2, 6, 5, 4, 4, 1, 1, 1, 5, 4, 4, 5, 6, 4, 3, 2, 6, 4, 5, 5, 5, 3, 3, 4, 1, 2, 1, 6, 4, 5, 1, 2, 6, 5, 2, 1, 2, 4, 1, 1, 4, 2, 1, 5, 4, 5, 2, 4, 3, 1, 2, 2, 3, 3, 1, 5, 3, 6, 5, 6, 1, 3, 2, 3, 3, 6, 5, 3, 1, 3}Sequence(CountIf[x ≟ k, rolls], k, 1, 6) → frequencies, {0, 0, 0, 0, 0, 0}Sequence(1, 6) → labelsBarChart(labels, frequencies) → aIf(Max[frequencies] < 10, 11, (Max[frequencies] * 1.15)) → maxSequence(sumlist(k), k, 91, 100) → last10, {6, 4, 3, 1, 6, 4, 4, 5, 6, 4}BarChart(labels, frequencies) → b
AI Drawing Prompt Reference
Create a simulation of rolling a six-sided die. First, generate 100 random rolls, then count the occurrences of each number. Next, create a bar chart to display these frequencies. Finally, show the results of the last 10 rolls.
The prompt above was compiled from the original drawing commands and is for reference only.