
Roller Coaster Function Graph and Calculus Demo
Loading the math board and drawing, please wait…
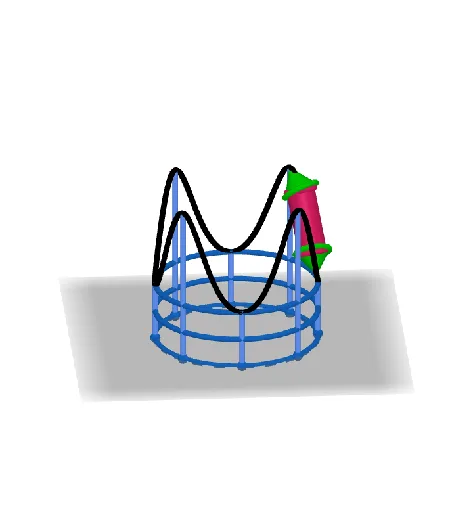
This example dynamically demonstrates the function graph of a roller coaster, showcasing core calculus concepts. It involves function graphs, derivatives, integrals, special points, secant lines, statistical characteristics, circumcircle, etc. Construction highlights include GeoGebra commands/objects like CurveCartesian, Sequence, Cylinder, Cone. Suitable for high school and above students learning functions and calculus applications.
GeoGebra Commands & Parameters
CurveCartesian((sqrt(2) * cos(u)), (sqrt(2) * sin(u)), ℯ^(((4 * sin(u)^(2)) * cos(u)^(2))), u, 0, (2 * π)) → aSequence(((sqrt(2) * cos(((j * π)) / 20)), (sqrt(2) * sin(((j * π)) / 20)), 0), j, 0, 180, 15) → l1CurveCartesian((sqrt(2) * cos(u)), (sqrt(2) * sin(u)), 0, u, 0, (2 * π)) → bCurveCartesian((sqrt(2) * cos(u)), (sqrt(2) * sin(u)), 0.5, u, 0, (2 * π)) → cCurveCartesian((sqrt(2) * cos(u)), (sqrt(2) * sin(u)), 1, u, 0, (2 * π)) → dSequence(((sqrt(2) * cos(((j * π)) / 20)), (sqrt(2) * sin(((j * π)) / 20)), ℯ^((((2 * sin((j * π / 20))) * cos((j * π / 20))))^(2))), j, 0, 180, 15) → l2Sequence(Segment[Element[l1, i], Element[l2, i]], i, 1, Length[l1]) → l3Cylinder(A, B, 0.25) → e, g, h, iCone(B, C, 0.3) → j, j_2, j_3Cone(A, D, 0.3) → l, p, m
AI Drawing Prompt Reference
Draw a roller coaster-shaped function graph, showing its derivative and integral curves, including tangent lines and special points, with cylinders and cones of different heights to represent geometric construction, starting from the basic function curve, gradually adding highlighted points and statistical features, and finally decorating the graph with cylinders and cones.
The prompt above was compiled from the original drawing commands and is for reference only.