
Revenue, Cost, Profit Intro
Loading the math board and drawing, please wait…
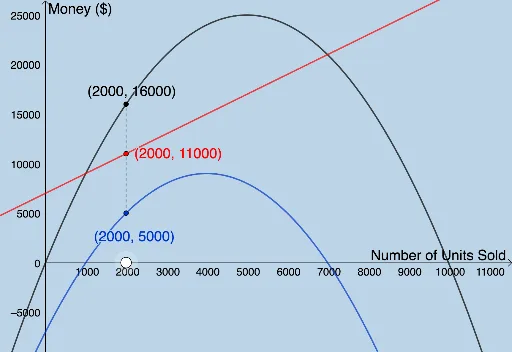
This example demonstrates the functional relationships and geometric representations of revenue, cost, and profit as a function of sales volume. Key math concepts include quadratic functions, ratios, special points, geometric mean, and pie charts. Construction highlights involve using commands like Intersect and Segment to plot key points (R, C, P) and auxiliary points (a, D), along with objects like functions (f) and ellipses (E). Suitable for high school mathematics education, integrating economic models with function graphs.
GeoGebra Commands & Parameters
Intersect(P, f, 1) → EIntersect(C, f, 1) → FIntersect(R, f, 1) → GSegment(E, F) → gSegment(F, G) → h
AI Drawing Prompt Reference
Draw a coordinate plane with a parabolic cost function curve)Skip, along with two straight lines representing revenue and profit functions. Mark the intersection points of the cost curve with the revenue line, the profit line, and an auxiliary curve, then connect adjacent intersection points with two line segments. The graph illustrates the functional relationships among sales volume, revenue, cost, and profit, highlighting key intersections and the break-even region.
The prompt above was compiled from the original drawing commands and is for reference only.