
Representing Inequalities on a Number Line
Loading the math board and drawing, please wait…
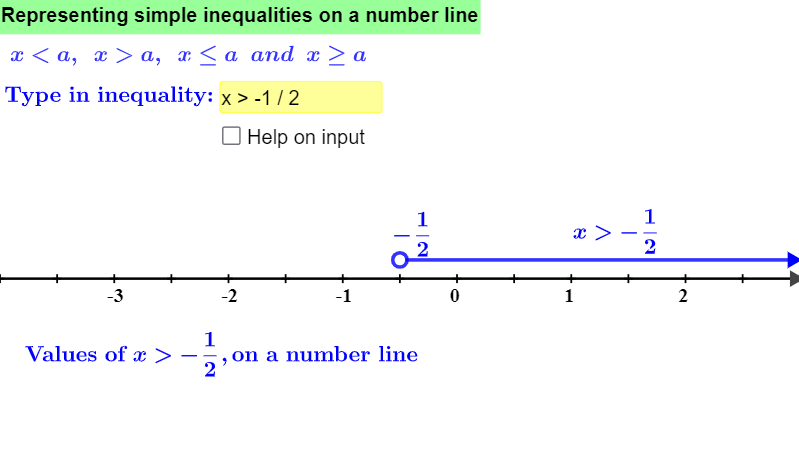
This example demonstrates how to represent inequalities on a number line. It involves core math concepts like inequalities and number line representation. Construction uses GeoGebra commands and objects such as Textfield, Segment, Remove, If, IndexOf, Sequence, Denominator. Suitable for middle school and above students learning basic inequality representation.
GeoGebra Commands & Parameters
Textfield(a) → InequalitySegment((x(P_{arrowright}), s_n), (x(Corner[2]), s_n)) → xAxis_{continuation}Textfield(xLeft) → InputBox1Textfield(xRight) → InputBox2Remove({IndexOf[8804, TextToUnicode[Text[a]]], IndexOf[62, TextToUnicode[Text[a]]], IndexOf[8805, TextToUnicode[Text[a]]], IndexOf[60, TextToUnicode[Text[a]]]}, {NaN, NaN, NaN}) → l1If(Min[a] < -100000, Max[a], Min[a]) → ineqnumpivotIndexOf(3, listidentifyIneq) → numidentifyIneqIf(numidentifyIneq ≟ 2 ∨ numidentifyIneq ≟ 4, Midpoint[(x(Corner[2]), 1), (ineqnumpivot, 1)], Midpoint[(x(Corner[1]), 1), (ineqnumpivot, 1)]) → P_{ineqtext}Sequence(Text[LaTeX[i], (i - ticksize / 5 + n_t, -1.8 + s_n)], i, xLeft + 1, xRight - 1, ticksize) → ListxaxisNumbersDenominator(ineqnumpivot) → denompivotSequence((i, s_n), i, xLeft, xRight, 1 / denompivot) → listTicks