
Relationship between Base Length and Volume of a Square Pyramid (LR8-01-XT2)
Loading the math board and drawing, please wait…
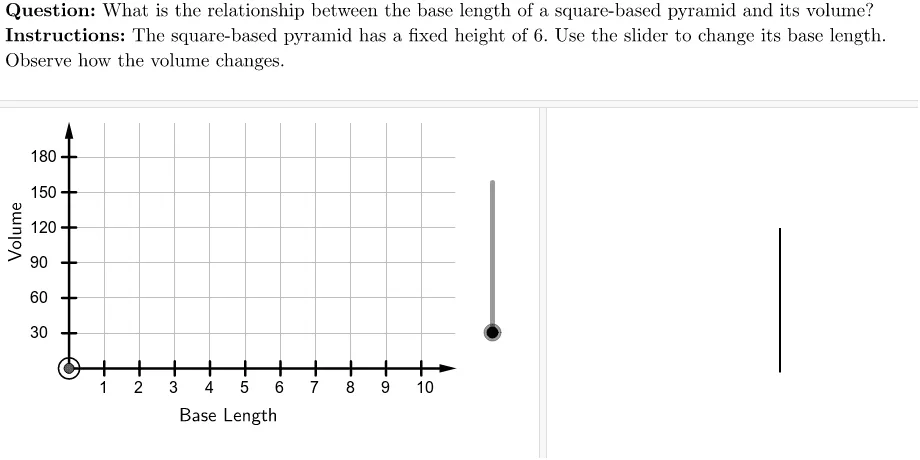
This interactive GeoGebra example demonstrates how the volume of a square-based pyramid changes as the base length varies, using a scatter plot and function graph. The core mathematical concept is the pyramid volume formula V = (1/3) × base area × height, showing a cubic relationship between base length and volume, with a limit as base length approaches zero. The construction uses GeoGebra commands: Polygon to create the square base, Pyramid to build the 3D solid, Sequence and Vector to generate base length values and corresponding volume data points, Zip to combine points into a scatter plot, Circle to mark the current point, RotateText for rotated labels, and Text for instructions. Suitable for middle school advanced or high school students exploring solid geometry, function graphing, and sequences.
GeoGebra Commands & Parameters
LaTeX((((("\text{" * QUESTION) * "\\") * INSTRUCTIONS) * "}")) → TEXTPolygon({(0, 0), (0, 7), (11, 7), (11, 0)}) → viewBoxSequence(Segment[(i, -0.2), (i, 0.2)], i, 1, 10) → xTicksSequence(i, i, xInc, 10, xInc) → xTickLabelsSequence(i, i, yInc, 180, yInc) → yTickLabelsPolygon((0, 0), (0, baseLength), 4) → pyramidBaseVector((0, 0), (11, 0)) → uVector((0, 0), (0, 7)) → vSequence(Segment[(-0.2, i), (0.2, i)], i, 1, 6) → yTicksSequence(Text[Element[xTickLabels, i], (i - 0.15, -0.7)], i, 1, 10) → xAxisTickLabelsSequence((i, volumePyramid(i)), i, 0, maxBaseLengthVisited, 0.5) → pointsToPlotZip((x(A) / xInc, y(A) / yInc), A, pointsToPlot) → pointsToPlotAdjustedCircle(currentPoint, 0.3) → currentCircleRotateText(Text["\text{Volume}", (-1.75, 5)], 90°) → yAxisLabelPyramid(pyramidBase, height) → pyramid, A, face1, face2, face3, face4, edge1, edge2, edge3, edge4Sequence(Text[Element[yTickLabels, i], (-1.1, i - 0.15)], i, 1, 6) → yAxisTickLabelsText("\text{Base Length}", (3, -1), false, true) → xAxisLabel
AI Drawing Prompt Reference
Draw a 2D coordinate system with the horizontal axis representing base length and the vertical axis representing volume, showing a curve starting from the origin that increases cubically. Place a 3D square-based pyramid diagram with adjustable base length, and overlay a scatter plot of volume values for different base lengths, highlighting the current data point with a circle. Label the axes as 'Base Length' and 'Volume', include tick marks and numbers, and add brief instructional text.
The prompt above was compiled from the original drawing commands and is for reference only.