
Relating a Linear Graph to its Equation
Loading the math board and drawing, please wait…
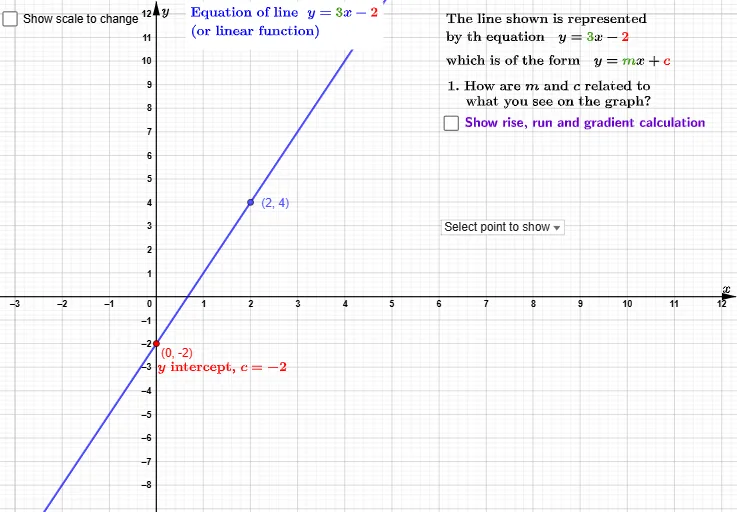
This example demonstrates the relationship between a linear graph and its equation in slope-intercept form through interactive GeoGebra activities. Key math concepts include linear functions, slope, intercept, and coordinate geometry. It utilizes commands like Line, Intersect, Slope, and Point. Suitable for high school mathematics teaching or self-study to understand the geometric meaning of linear equations.
GeoGebra Commands & Parameters
Line(B, P_{1}) → fIntersect(f, yAxis) → CSlope(f) → mIf(Defined[Line[B, P_{1}]], true, false) → lineexistsIf(x(P_{1}) < x(B), Vector[P_{1}, N], Vector[N, P_{1}]) → vIf(x(P_{1}) > x(B), Vector[B, N], Vector[N, B]) → uIf(m < 0, If[x(P_{1}) ≤ x(B), y(N) - y(P_{1}), y(N) - y(B)], If[x(P_{1}) ≤ x(B), y(B) - y(N), y(P_{1}) - y(N)]) → riseIf(m ≤ 0, If[x(P_{1}) ≤ x(B), x(B) - x(N), x(P_{1}) - x(N)], If[x(P_{1}) ≤ x(B), x(N) - x(P_{1}), x(N) - x(B)]) → runGCD(rise, run) → aPoint(f) → PCoordPointertoAxes7a(P) → w, e, text12, text13, text14, text15, text16, A, DCoordPointertoAxes7a(Q) → h, i, text17, text18, text19, text20, text21, E, F
AI Drawing Prompt Reference
Draw a line and display its slope-intercept equation. Mark the intersection point of the line with the y-axis and calculate the slope of the line. Based on the slope, take a point on the line and draw a vector representing the slope. Finally, label the slope and intercept of the line and display its equation.
The prompt above was compiled from the original drawing commands and is for reference only.