
Related Rates: Volume Change with Height in a Conical Vessel
Loading the math board and drawing, please wait…
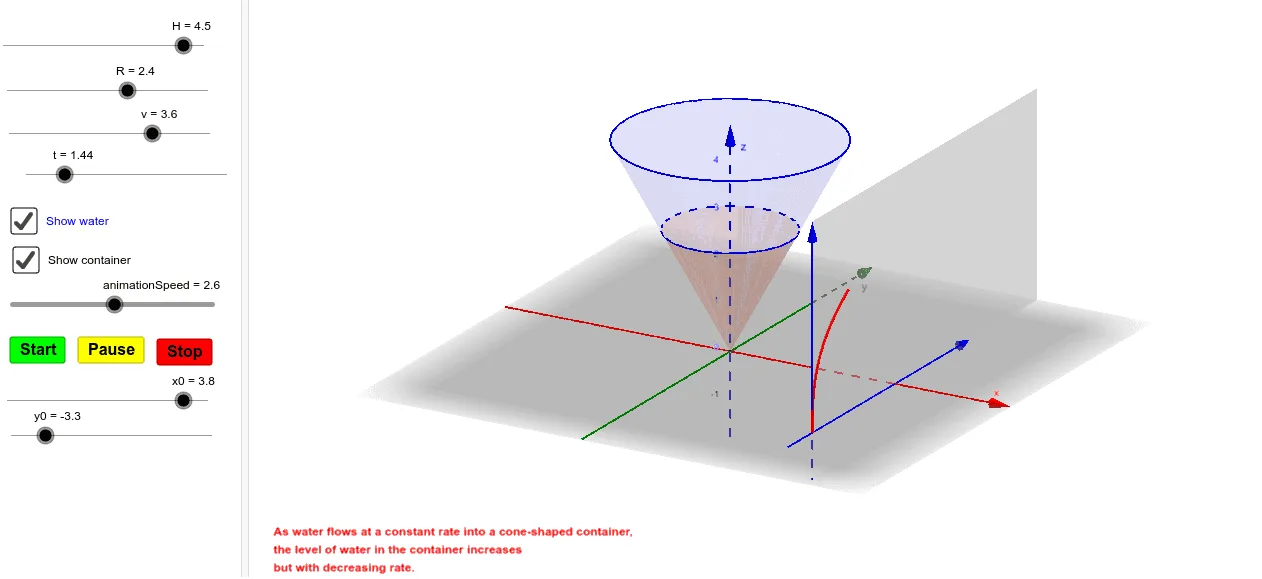
This GeoGebra example demonstrates the related-rates relationship between the water volume and the water height inside a conical container using dynamic 3D geometry. It focuses on key ideas such as related rates, the cone volume formula, variable substitution/algebra, and parameter-driven change (e.g., height as a time-dependent variable). Construction-wise, the model uses the Cone and Surface commands to build the cone and the water region, while CurveCartesian represents supporting functional relationships in the coordinate plane. Vectors (Vector) help define geometric direction or auxiliary quantities. The visualization is controlled by parameters/sliders and animation timing (e.g., t and animationSpeed), along with key geometric variables such as radius and heights (r, H, h) and the resulting volume quantity. UI elements (buttons/controls like przycisk and button1, plus labels/graph components) support step-by-step exploration. Suitable for high school to early university calculus, especially for teaching how derivatives/instantaneous rates connect to 3D geometry.
GeoGebra Commands & Parameters
Cone(P, O, r(t)) → StozekWody, d, aCone(Q, O, R) → StozekNaczynie, c, bVector(S - (0, 0, 1), S + (0, 0, H)) → pomOsZVector(S - (0, 1, 0), S + (0, (-y0) + 3, 0)) → pomOsTCurveCartesian(x0, y0 + s, h(s), s, 0, t) → wykresPoziomuSurface(x0, t, s, t, y0, (-y0) + 3, s, 0, H) → e
AI Drawing Prompt Reference
Create a 3D visualization of a conical vessel filled with water, showing two related cone constructions: one cone represents the container and another, using a height-dependent radius, represents the water region. Let the water height vary from 0 up to a final value H, with the radius tied to the height through a parameter (e.g., r(t)), and drive the motion using a slider/animated parameter so the water height changes over time. Include auxiliary vectors to indicate vertical direction and a reference axis. Add a 2D curve in a coordinate plane to support the functional relationship between the chosen horizontal variable and the water height. Emphasize the geometric link between changing height and the corresponding change in the water volume.
The prompt above was compiled from the original drawing commands and is for reference only.