
Regression, Correlation, and Hypothesis Testing
Loading the math board and drawing, please wait…
In collections
Pearson Maths A level Statistics and Mechanics 2
Pearson Maths A level Statistics and Mechanics 2
Pearson Maths A level Statistics and Mechanics 2
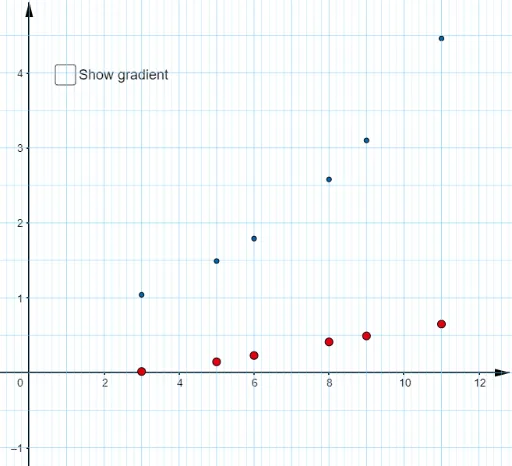
This example demonstrates the graphical process of regression analysis, correlation coefficient calculation, and hypothesis testing. It involves core mathematical concepts like linear regression models, correlation coefficient r, P-values, and confidence intervals. GeoGebra commands and objects used in the construction include Sequence, Matrix, lists, and Slider animations. Suitable for high school and above students and teachers in mathematics and statistics for teaching demonstrations and concept understanding.
GeoGebra Commands & Parameters
Sequence(Segment[(i, -100), (i, 100)], i, -50, 50, 0.2) → list3Sequence(Segment[(i, -100), (i, 100)], i, -50, 50, 1) → list4Sequence(Segment[(-100, i), (100, i)], i, -50, 200, 1) → list1Sequence(Segment[(-100, i), (100, i)], i, -50, 200, 0.5) → list2
AI Drawing Prompt Reference
Draw a coordinate system with multiple horizontal and vertical lines extending from the axes to a certain range, forming a grid-like background to illustrate the process of regression analysis, correlation coefficient, and hypothesis testing, where some lines are denser and others are sparser to highlight key areas.
The prompt above was compiled from the original drawing commands and is for reference only.