
Region Bounded by Two Inequalities
Loading the math board and drawing, please wait…
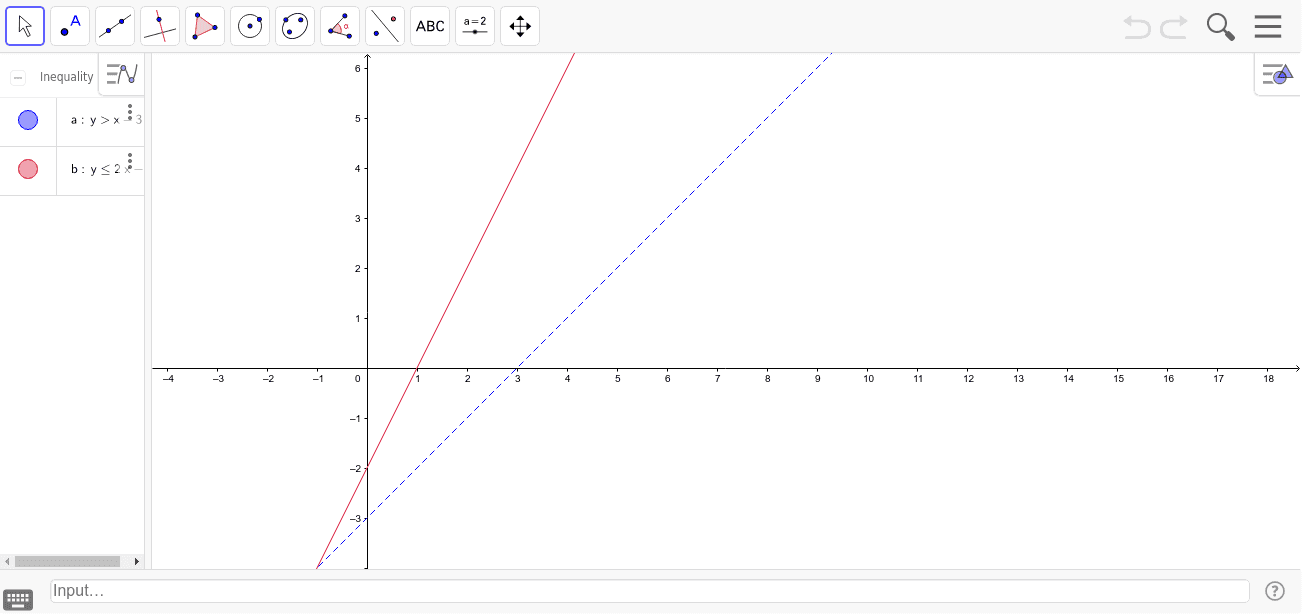
This example plots two inequalities but does not show the shaded regions. Students must manually add the shaded regions to determine the properties of the bounded area. The example involves plotting inequalities and adding shaded regions, using GeoGebra objects a and b. Suitable for high school math education to help students understand inequalities and shaded regions.
GeoGebra Commands & Parameters
a(x, y) = y > x - 3b(x, y) = y ≤ 2 * x - 2