
Bounded Region by Two Inequalities (Shading Practice)
Loading the math board and drawing, please wait…
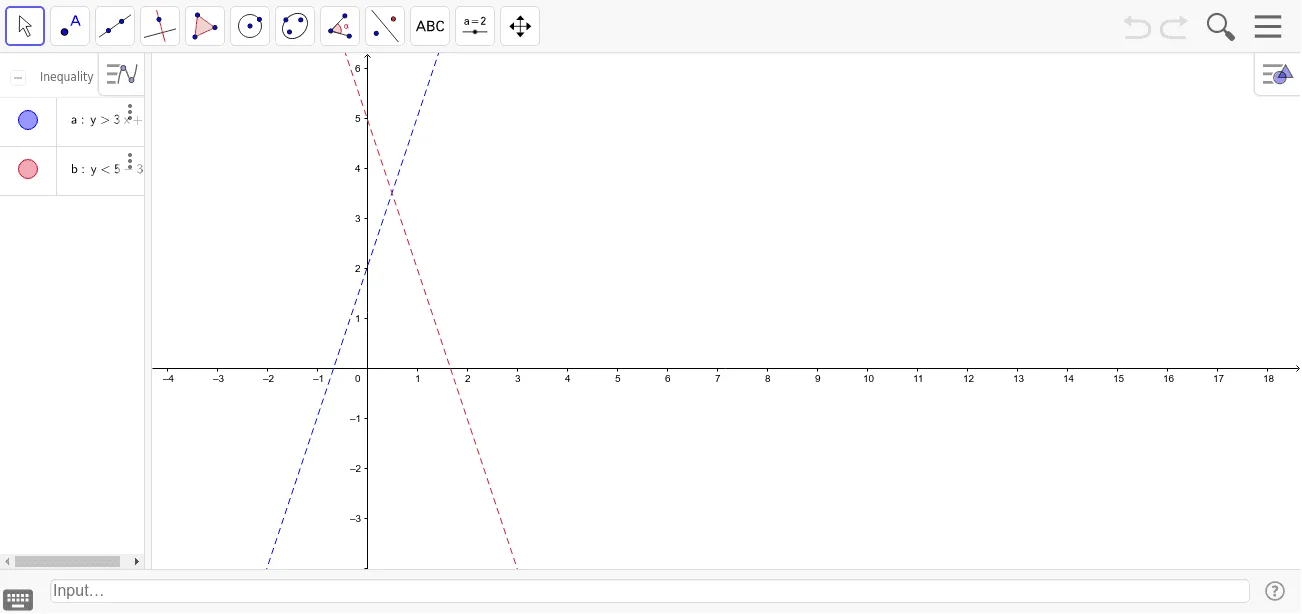
① This example demonstrates how two inequalities define a bounded region on the coordinate plane, but the shaded area is intentionally omitted for students to add. ② Core math concepts include linear inequalities, intersection of regions, boundary lines, feasible region, and graphical representation of solution sets. ③ Construction notes: From the summary, only objects a and b (likely two lines or curves) are created without shading commands, so students must use GeoGebra's inequality tools or manually draw the region, understanding solid/dashed boundaries and direction. ④ Suitable for upper middle school or high school exercises on graphing inequality systems, reinforcing visual reasoning and region determination.
GeoGebra Commands & Parameters
a(x, y) = y > 3 * x + 2b(x, y) = y < 5 - 3 * x
AI Drawing Prompt Reference
Draw a coordinate plane with two boundary lines: one line with slope 3 and y-intercept 2, and another line with slope -3 and y-intercept 5. Both lines should be solid, and the region between them should be left unshaded, as a blank area for students to fill. The two lines intersect at a point, forming a bounded region. Make sure the axes and grid are visible so the boundaries are clear.
The prompt above was compiled from the original drawing commands and is for reference only.