
Regiomontanus View Optimization
Loading the math board and drawing, please wait…
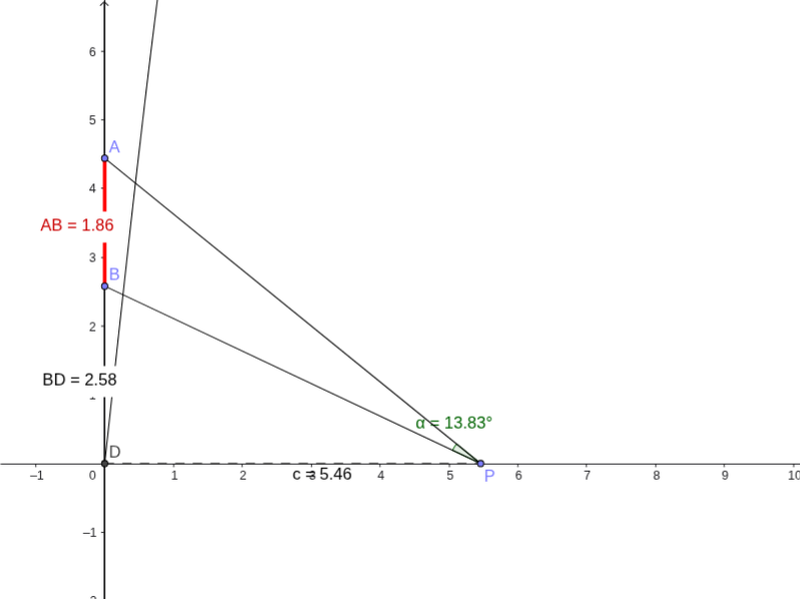
This example demonstrates how to dynamically adjust the viewing angle to optimize observation. It involves core math concepts like angles, hyperbolas, conic sections, geometric constructions, binomial distribution, and right triangles. Construction highlights include using GeoGebra commands and objects such as points, intersections, segments, angles, lines, loci, and distances. Suitable for high school and above, exploring geometric and statistical applications of view optimization.
GeoGebra Commands & Parameters
Point(yAxis) → APoint(yAxis) → BPoint(xAxis) → PIntersect(xAxis, yAxis) → DSegment(A, P) → aSegment(P, B) → bAngle(A, P, B) → αSegment(D, P) → cLine(A, B) → dLocus(E, P) → loc1Segment(A, B) → eDistance(A, B) → distanceABDistance(B, D) → distanceBD
AI Drawing Prompt Reference
Draw the x-axis and y-axis, select two arbitrary points on the y-axis and one arbitrary point on the x-axis. Connect the two points and the point on the x-axis. Measure the angle formed between the line connecting the two points and the x-axis. Draw a circle centered at the point on the x-axis that is tangent to both the x-axis and y-axis. Measure the distance between the line segment and the x-axis, and draw the perpendicular bisector of the line segment. Finally, find the intersection point of the line segment and the perpendicular bisector.
The prompt above was compiled from the original drawing commands and is for reference only.