
Reflection and Transmission of a Pulse Wave
Loading the math board and drawing, please wait…
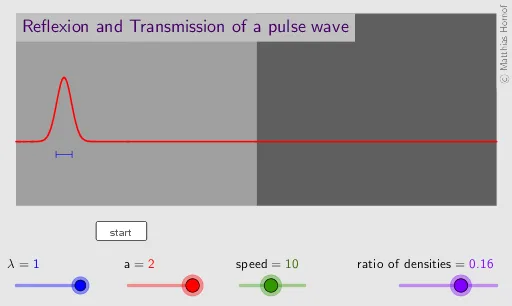
① This GeoGebra example dynamically demonstrates the reflection and transmission of a pulse wave at an interface between two media, visualizing how the wave splits and changes shape. ② Core mathematical concepts include wave equations, reflection/transmission coefficients, piecewise functions (e.g., Heaviside step function), and limits, combined with geometric objects like segments and polygons to construct the wavefront. ③ Construction highlights: using commands such as Element, Segment, and Polygon to build base shapes; sliders (t, w0, SF0, etc.) control time and waveform parameters; functions fkt1 and fkt2 define incident, reflected, and transmitted waves; the Heavi (Heaviside) function truncates the pulse; dynamic updates show propagation and interaction at the boundary. ④ Suitable for high school physics (wave optics, mechanical waves) or introductory university physics courses, as well as for illustrating piecewise functions and limit concepts in mathematics.
GeoGebra Commands & Parameters
Element(LZ, m, 1) → z_1Element(LZ, m, 2) → z_2Segment((t - wl, -0.4), (t + wl, -0.4)) → fSegment((0, (-b)), (0, (2 * b))) → endSegment((t - wl, -0.3), (t - wl, -0.5)) → f_1Segment((t + wl, -0.3), (t + wl, -0.5)) → f_2Polygon((0, -2), (xmax, -2), (xmax, 4), (0, 4)) → strg2, g, h, i, jPolygon((0, -2), (xmin, -2), (xmin, 4), (0, 4)) → strg1, k, l, n, p
AI Drawing Prompt Reference
Draw a dynamic diagram showing reflection and transmission of a pulse wave at an interface between two media. A vertical line divides the canvas into left and right regions, each filled with a distinct color or pattern to represent different media. Short vertical marks at the top and bottom of the dividing line indicate boundary endpoints. On the left side, a horizontal segment represents the incident wave, moving with time; on the right, a transmitted wave appears, while a reflected wave also exists on the left. The pulse has a finite width, defined by a piecewise function, with its shape and amplitude controlled by sliders. Include time and waveform parameters, and illustrate how the wave splits and changes shape at the boundary.
The prompt above was compiled from the original drawing commands and is for reference only.