
Rectangle Maker: Area Approximation
Loading the math board and drawing, please wait…
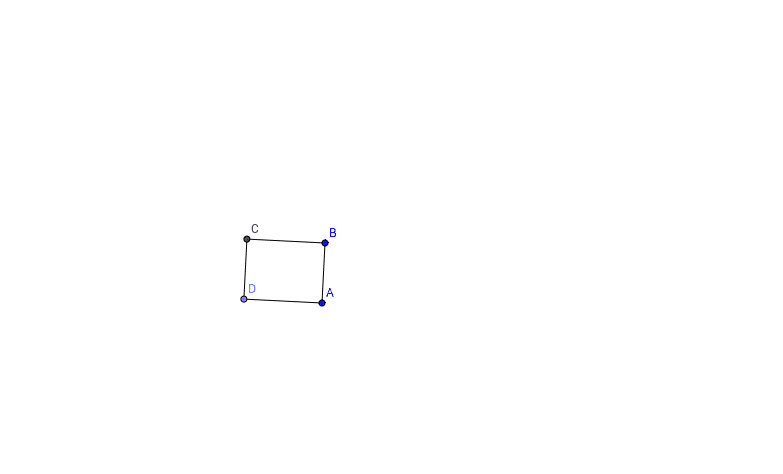
This GeoGebra example dynamically constructs rectangles to visually demonstrate the concept of upper and lower sums (Riemann sums) for approximating the area under a curve. It involves core mathematical concepts such as rectangle area, area under a curve, Riemann sums, and the geometric definition of the definite integral. The construction utilizes GeoGebra commands including Segment, OrthogonalLine, Point, and Intersect to dynamically generate rectangle vertices and compute total area. Ideal for high school calculus introduction, it helps students grasp the definition of the definite integral and the process of area approximation through interactive geometry and algebra.
GeoGebra Commands & Parameters
Segment(A, B) → aOrthogonalLine(A, a) → bOrthogonalLine(B, a) → cPoint(b) → DOrthogonalLine(D, b) → dIntersect(c, d) → CSegment(D, C) → eSegment(C, B) → fSegment(A, D) → g
AI Drawing Prompt Reference
Draw a rectangle to illustrate area approximation under a curve. Start with a horizontal base segment. At each endpoint, construct a vertical line upward. Pick a point on the left vertical line, then draw a horizontal line from that point to intersect the right vertical line, forming the top side. Connect this intersection point to the bottom right endpoint, and connect the bottom left endpoint to the chosen point, completing the rectangle. The rectangle should have a horizontal base, vertical sides, and right angles at all corners, with vertices clearly marked.
The prompt above was compiled from the original drawing commands and is for reference only.