
Recording Values to a Spreadsheet: GeoGebra Data Collection Basics
Loading the math board and drawing, please wait…
In collections
Learn GeoGebra Classic
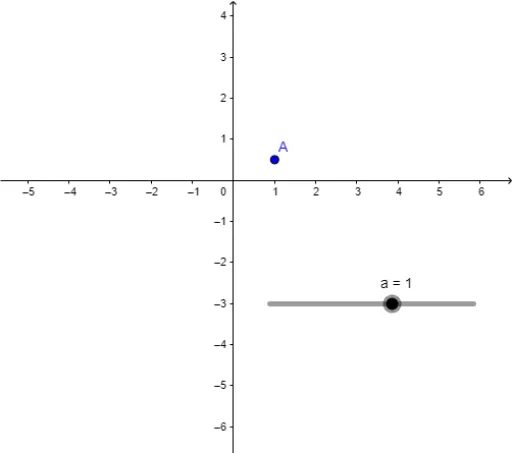
① This example demonstrates how to use GeoGebra to record dynamic values (such as coordinates, lengths, or slider outputs) into a spreadsheet in real time, creating a data list for analysis. ② Core mathematical concepts include data collection, variable tracking, statistics and probability (e.g., hypergeometric distribution, expected value), and measurements of geometric objects like cuboids and equilateral triangles. ③ Construction highlights: based on the summary, objects a and A are used, likely involving sliders or points whose changing values are automatically logged into the spreadsheet via the 'Record to Spreadsheet' feature, enabling subsequent data exploration. ④ Suitable for middle school or introductory statistics courses, this example helps students understand how dynamic data is generated, recorded, and tabulated, and can be applied to probability simulations or batch measurement of geometric quantities.
GeoGebra Commands & Parameters
Numeric a(1)(a, (1 / 2 * a))