
Reciprocal Linear Function Graphs
Loading the math board and drawing, please wait…
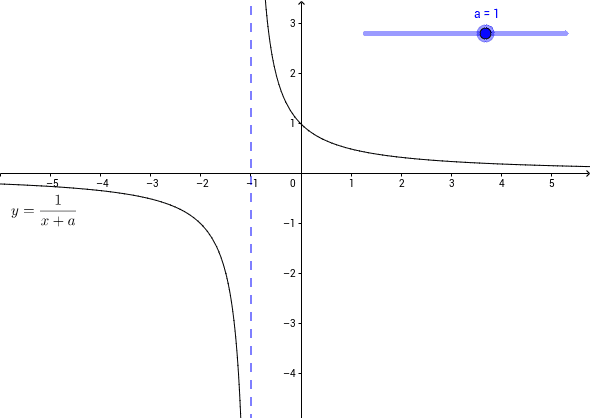
This example demonstrates the behavior of the reciprocal of the linear function y=x+a. It involves core math concepts like function graphs, reciprocal operations, and linear function properties. Constructed using GeoGebra objects a (parameter), f (function), and b (point). Suitable for high school mathematics education to understand the relationship between reciprocal function graphs and the impact of parameter changes on the graphs.
GeoGebra Commands & Parameters
Numeric a(1.0)f(x) = 1 / (x + a)x = (-a)
AI Drawing Prompt Reference
Draw the graph of the linear function y=x+a and its reciprocal function y=1/(x+a), marking the intersection point of the line with the x-axis to show how the parameter a affects the graph of the reciprocal function, illustrating the relationship between the reciprocal function and the linear function and the impact of parameter changes on the graph.
The prompt above was compiled from the original drawing commands and is for reference only.