
Randomly Generated Normal Distribution Practice Problems
Loading the math board and drawing, please wait…
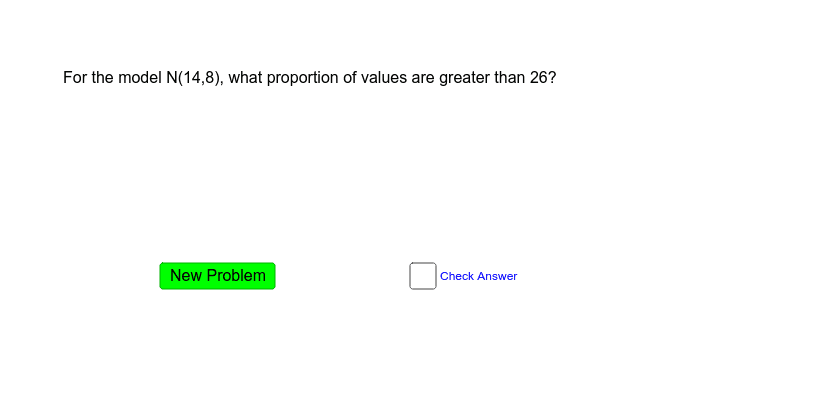
This example demonstrates typical normal distribution problems, allowing users to try different problems by dragging a slider. Answers can be checked as the user progresses.
The core math concepts involved include normal distribution and probability & statistics. Key GeoGebra commands used are Random (random number generation), Normal (normal distribution), and InverseNormal (inverse normal distribution function); objects include button1 (button), mean (mean), stdv (standard deviation), lowerbound (lower bound), upperbound (upper bound), lb (lower bound text), ub (upper bound text), text1 (text box), pctile (percentile), pctileans (percentile answer), text5 (text box), text4 (text box), text3 (text box), text2 (text box), text6 (text box), n (counter), text8 (text box), A (variable), a (variable), text9 (text box), B (variable), text10 (variable), text11 (variable), text12 (variable), text13 (variable), text7 (variable), text14 (variable), b (variable), c (variable), text15 (text box). Suitable for high school and above, for learning and practicing normal distribution.
GeoGebra Commands & Parameters
Random(10, 30) → meanRandom(2, 12) → stdvRandom(mean - (2 * stdv), mean + stdv) → lowerboundRandom(lowerbound + 1, mean + (2 * stdv)) → upperboundNormal(mean, stdv, lowerbound) → lbNormal(mean, stdv, upperbound) → ubRandom(1, 99) → pctileInverseNormal(mean, stdv, pctile / 100) → pctileansRandom(1, 7) → nInverseNormal(mean, stdv, (50 - pctile / 2) / 100) → bInverseNormal(mean, stdv, (50 + pctile / 2) / 100) → c
AI Drawing Prompt Reference
Create a graphic demonstrating normal distribution problems with a slider to generate different problems. Show a normal distribution curve that dynamically adjusts its mean and standard deviation based on the slider value, calculating and displaying corresponding lower and upper bounds and probability values. Include a text box to show the answer for the current problem and a counter to track attempts.
The prompt above was compiled from the original drawing commands and is for reference only.