
Random Dotplot and Normal Distribution Simulation
Loading the math board and drawing, please wait…
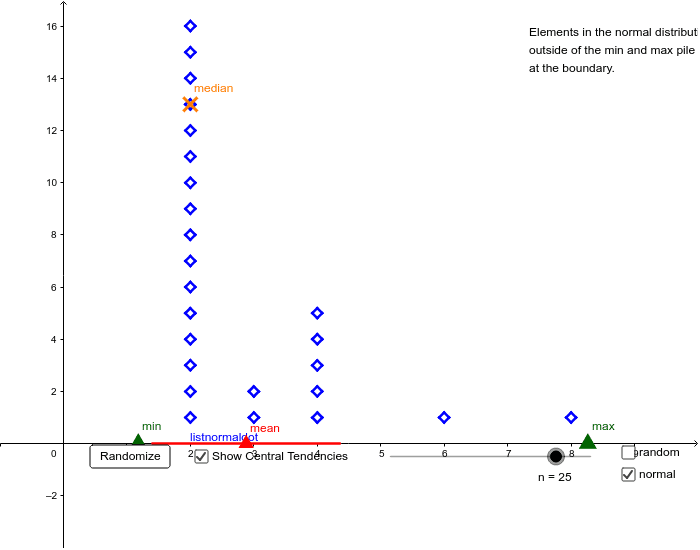
① This example demonstrates how to use a randomly generated dotplot to visualize data distribution and compare it with a normal distribution curve. ② Core mathematical concepts include random sampling, mean, standard deviation, normal distribution, mode, and data dispersion. ③ Construction highlights: using GeoGebra commands such as Point, Sort, DotPlot, MeanX, Mod, If, Random, SD, Segment, Min, Max to create random lists (listrandom) and normal distribution lists (listnormal), with a button (button1) to refresh randomness, and displaying statistics like mean and standard deviation. ④ Suitable for high school or college statistics courses to explore distribution shapes, normal approximation, and statistical visualization, serving as an interactive teaching tool for probability and statistics.
GeoGebra Commands & Parameters
Point(xAxis) → minPoint(xAxis) → maxSort(Sequence[Random[Mn, Mx], i, 1, n]) → listrandomDotPlot(listrandom) → listrandomdotMeanX(listrandomdot) → aMod(n, 2) → parityIf(parity ≟ 1, Element[listrandomdot, ceil(n / 2)], (Element[listrandomdot, n / 2] + Element[listrandomdot, n / 2 + 1]) / 2) → BRandom(Mn, Mx) → centSort(Sequence[f(RandomNormal[cent, stdv]), i, 1, n]) → listnormalDotPlot(listnormal) → listnormaldotIf(parity ≟ 1, Element[listnormaldot, ceil(n / 2)], (Element[listnormaldot, n / 2] + Element[listnormaldot, n / 2 + 1]) / 2) → DMeanX(listnormaldot) → cSD(listnormal) → StDvSegment(C - (StDv, 0), C + (StDv, 0)) → gIf(d, Max[8, Max[y(listrandomdot)]], Max[8, Max[y(listnormaldot)]]) → maxYMin(-1, Mn - 2) → minXMax(10, Mx + 2) → maxX
AI Drawing Prompt Reference
Create a dotplot of randomly generated data points along a horizontal axis, sorted in ascending order, and overlay a normal distribution curve for comparison. Generate a second set of data points following a normal distribution, also displayed as a dotplot. For each dotplot, compute and display the median and mean. Draw a horizontal segment centered at the mean of the normal data, with length equal to two standard deviations. Include a button to regenerate all random data, refreshing the entire visualization.
The prompt above was compiled from the original drawing commands and is for reference only.