
Ramanujan's Approximation Formula for Pi
Loading the math board and drawing, please wait…
In collections
Pi Approximations
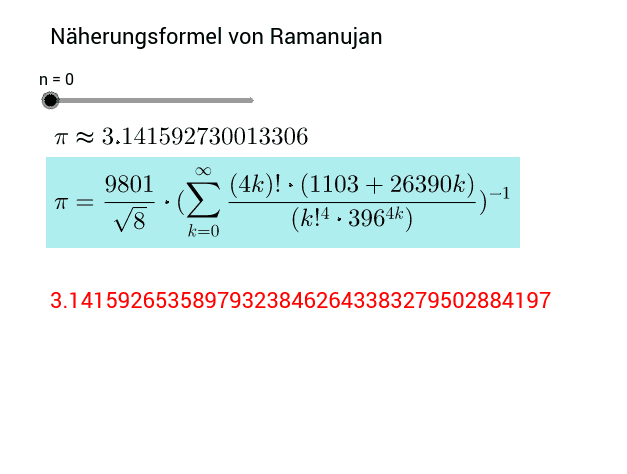
This example demonstrates the graphical representation of S. Ramanujan's approximation formula for Pi. It involves core mathematical concepts such as sequences, series summation, function graphing, and inequality analysis. The construction utilizes GeoGebra commands like Sequence and Sum, along with objects like n, s, ss, pp, and Text1-Text4 for dynamic visualization. Suitable for high school and above mathematics learners to understand the application and visualization of classic mathematical formulas.
GeoGebra Commands & Parameters
Sequence((((4 * k))! * (1103 + (26390 * k)) / ((k!^(4) * 396^((4 * k))))), k, 0, n) → sSum(s) → ss
AI Drawing Prompt Reference
Draw a graph to illustrate the function of Ramanujan's approximation formula for calculating Pi, using a sequence and summation formula from k=0 to n, dynamically displaying the sequence s and the total ss, and analyzing their relationship with Pi, verified by inequalities, suitable for high school and above mathematics learners to understand the application and visualization of classic mathematical formulas.
The prompt above was compiled from the original drawing commands and is for reference only.