
Quiz Guessing Simulation
Loading the math board and drawing, please wait…
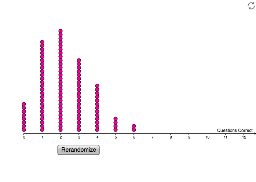
This example demonstrates the statistical distribution of results when guessing answers on a quiz. It involves core math concepts like Probability & Statistics and Data Visualization. The construction uses GeoGebra's DotPlot command and objects list1, button1 to visualize data distribution, making it suitable for high school students learning probability statistics and data analysis to understand the pattern of random event outcomes.
GeoGebra Commands & Parameters
DotPlot(Sequence[RandomBinomial[10, 0.25], a, 1, 100], false, 0.2) → list1