
Quick Start: Trigonometric Function Grid
Loading the math board and drawing, please wait…
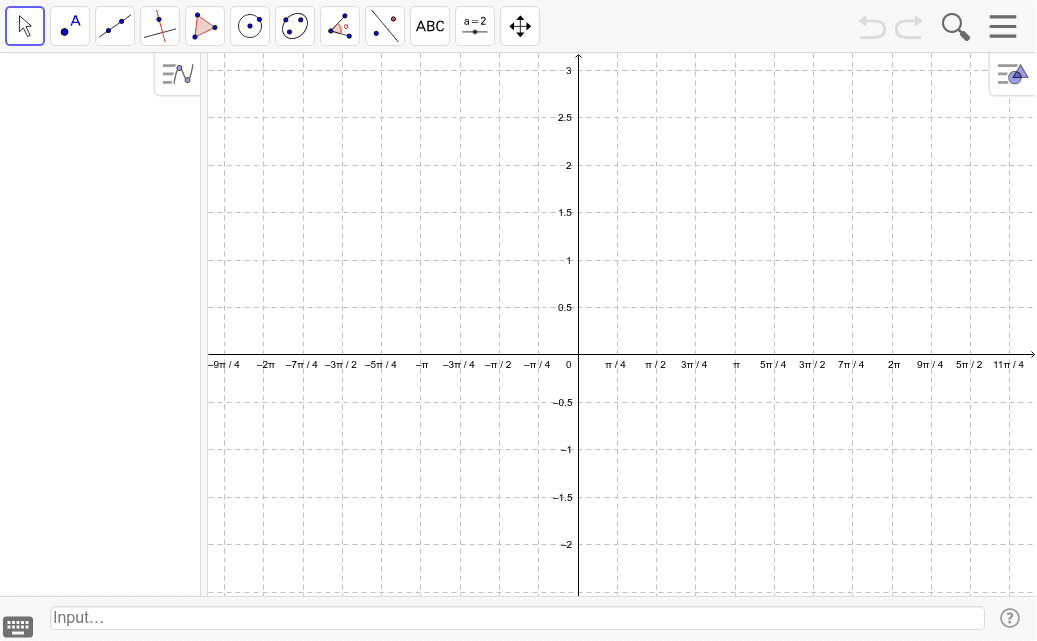
This GeoGebra example demonstrates how to create a trigonometric coordinate grid and visualize the relationship between the sine function in the unit circle and the Cartesian coordinate system. The core mathematical concepts include the definition of sine function, unit circle coordinates, periodicity of trigonometric functions, and coordinate geometry representation. Construction highlights: Using the function graphing tool to plot y=sin(x), incorporating slider animations to dynamically adjust parameters, observing how the function curve changes across the grid, and marking special points (such as x-intercepts and extreme points) to help understand the properties of trigonometric functions. This example is suitable for high school mathematics students learning sine function graphs for the first time, or for classroom teaching demonstrations of basic sine function properties.
AI Drawing Prompt Reference
Draw a coordinate system containing a unit circle and a sine function graph. Mark a moving point on the unit circle whose y-coordinate corresponds to the sine value as the angle changes. In the Cartesian grid on the right, plot the sine curve y=sin(x), extending across the grid, and label the x-intercepts and the maximum and minimum points. Add a slider to control the angle or parameter, so that the moving point and the corresponding point on the curve move together, illustrating the periodicity and coordinate relationship of the sine function.
The prompt above was compiled from the original drawing commands and is for reference only.