
Quadratic Inequalities by Jonathan Robinson
Loading the math board and drawing, please wait…
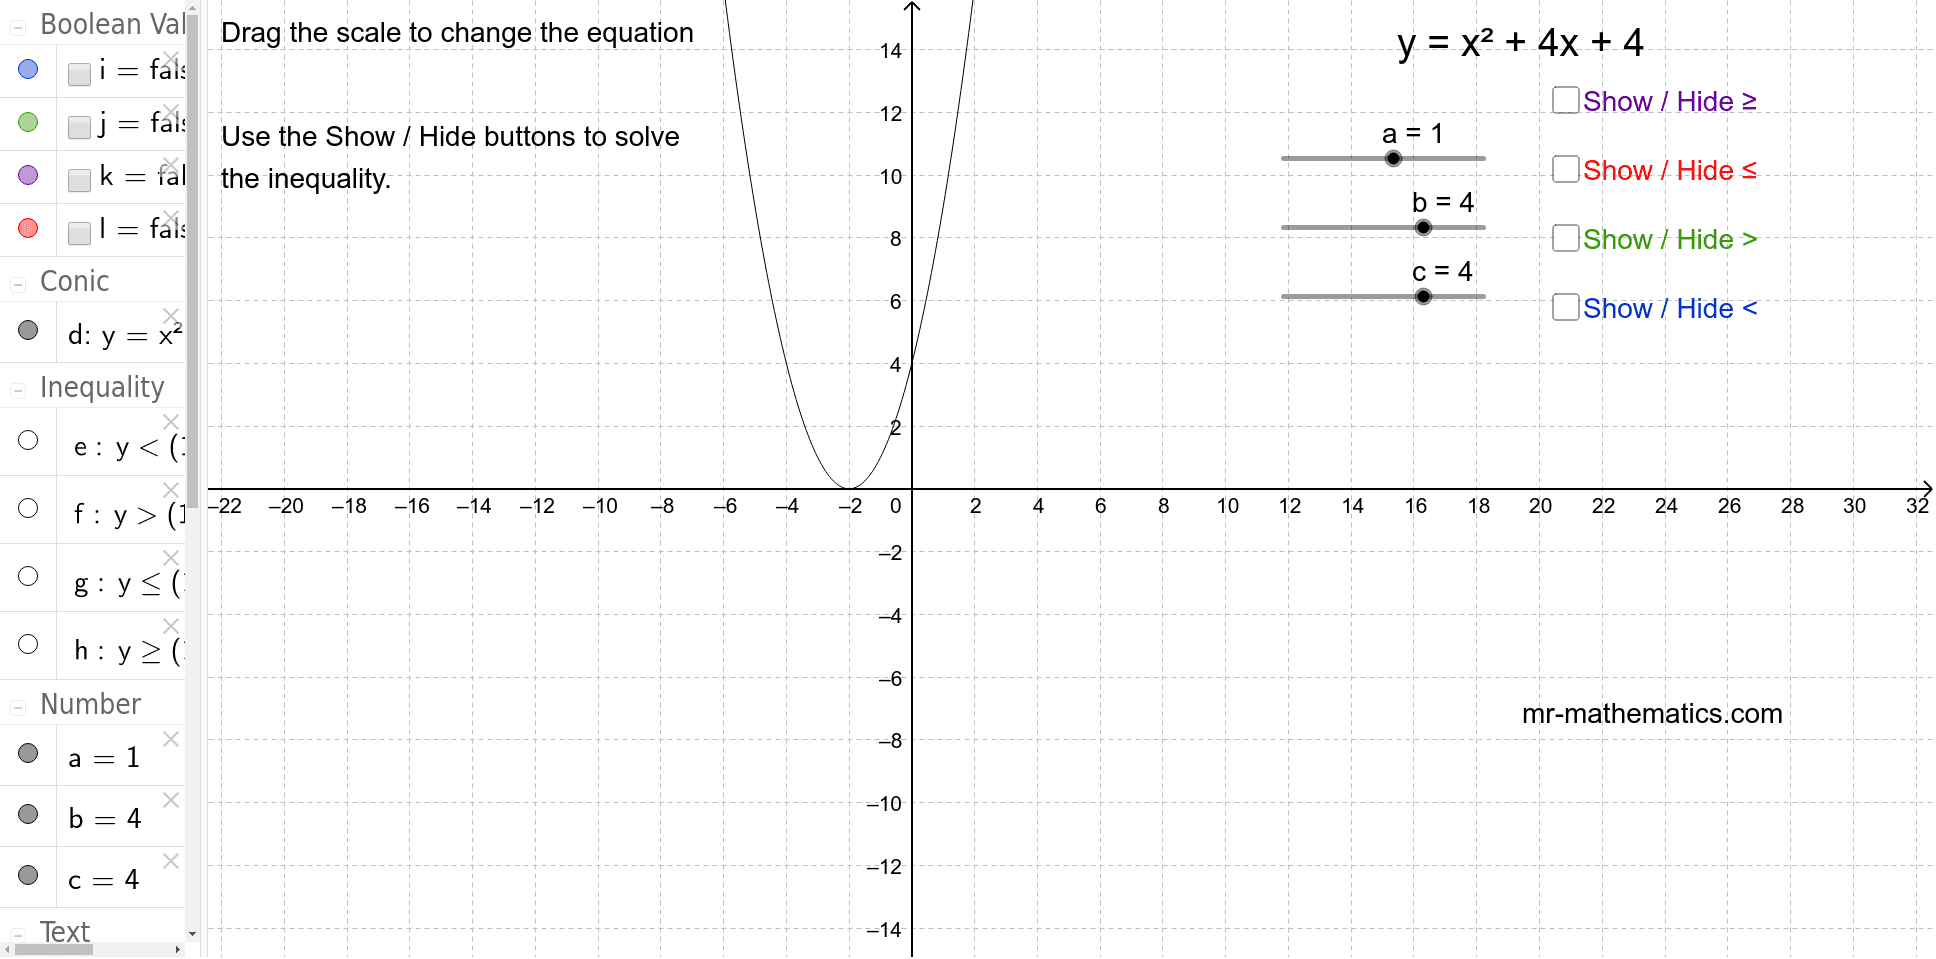
Explore the solutions of quadratic inequalities by adjusting parameters. This example focuses on the concept of quadratic inequalities and their solutions. It utilizes GeoGebra's slider animation and show/hide buttons. Suitable for middle school and above students to learn the solution methods and applications of quadratic inequalities.
GeoGebra Commands & Parameters
Numeric a(1.0)Numeric b(4.0)Numeric c(4.0)y = ((a * x))^(2) + (b * x) + ce(x, y) = y < ((a * x))^(2) + (b * x) + cf(x, y) = y > ((a * x))^(2) + (b * x) + cg(x, y) = y ≤ ((a * x))^(2) + (b * x) + ch(x, y) = y ≥ ((a * x))^(2) + (b * x) + cBoolean i(false)Boolean j(false)Boolean k(false)Boolean l(false)
AI Drawing Prompt Reference
Draw a quadratic function graph and display its inequality solution sets. Adjust parameters via sliders to show the function y = ax^2 + bx + c, with different colors for y < ax^2 + bx + c, y > ax^2 + bx + c, y ≤ ax^2 + bx + c, and y ≥ ax^2 + bx + c regions. Start with a=1, b=4, c=4, and use toggles to control the visibility of each inequality solution set.
The prompt above was compiled from the original drawing commands and is for reference only.