
Quadratic Functions Part 2: Vertex Form and Transformations
Loading the math board and drawing, please wait…
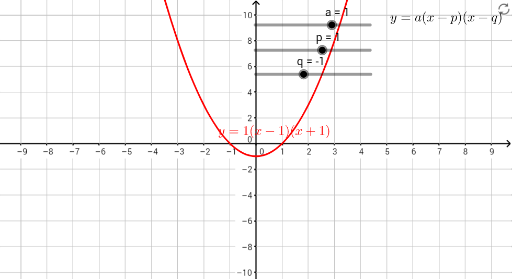
This GeoGebra example demonstrates the graph of a quadratic function in vertex form y = a(x - p)^2 + q, showing how changes in parameters a, p, and q affect the parabola's shape and position. Core mathematical concepts include the vertex form of a quadratic, axis of symmetry, direction of opening, vertex coordinates, and horizontal/vertical translations. The construction uses the If command to create conditional logic, sliders for parameters a, p, and q, a point A representing the vertex, symbols Psign and Qsign for sign indication, list1 for data storage, and text1/text2 for dynamic labels. It is suitable for middle and high school students learning quadratic function properties, parameter effects, and the connection between algebra and geometry, either for classroom demonstration or independent exploration.
GeoGebra Commands & Parameters
If(p > 0, "", "+") → PsignIf(q > 0, "", "+") → QsignIf(p > q, (q + 1, 0), (p + 1, 0)) → A
AI Drawing Prompt Reference
Draw a graph of a quadratic function in vertex form y = a(x - p)^2 + q, showing how parameters a, p, q affect the parabola's shape and position, label the axis of symmetry and vertex, use symbols to indicate the sign of parameters, and dynamically adjust parameters with sliders while displaying vertex coordinates and parameter effects with text.
The prompt above was compiled from the original drawing commands and is for reference only.