
Quadratic Functions Anatomy (3): Graph, Roots, and Coordinates
Loading the math board and drawing, please wait…
In collections
Quadratic Functions Anatomy and Transformations
Transforming Quadratic Function Graphs
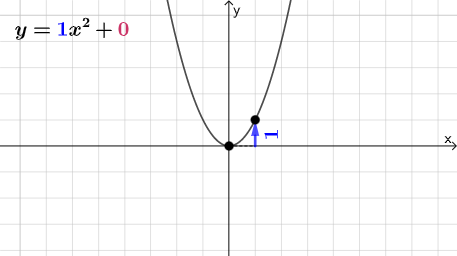
This GeoGebra example provides an interactive dissection of a quadratic function's graph, highlighting the parabola, vertex, axis of symmetry, roots (zeros), and the relationship between coordinates and slopes on the curve. Core mathematical concepts include the standard form of a quadratic function, graph transformations, the discriminant and root conditions, and the geometric meaning of average rate of change (slope between two points). The construction uses GeoGebra commands such as Point, Line, Segment, Vector, Polygon, and RotateText to create points, lines, vectors, and polygons, with text labels rotated for clarity. Sliders or parameter objects (like a, b, c) allow dynamic adjustment of coefficients, enabling real-time observation of how the graph changes. This resource is suitable for middle and high school students learning quadratic functions, as well as for teachers demonstrating the connection between algebraic expressions and graphical features. It supports inquiry-based learning, helping students visualize how coefficients affect the parabola's opening, position, and roots, and how slopes between points relate to the function's behavior.
GeoGebra Commands & Parameters
Point(Segment[(h + 1, y(C) + 10), (h + 1, y(C) - 10)]) → DLine(A, B) → fVector(A, C) → uPolygon(A, C, B) → t1, b, a_1, cRotateText(text2, π / 2) → text3Segment(A, C) → h_{1}Vector(C, D) → vVector((h, 0), A) → wVector((0, 0), (h, 0)) → j
AI Drawing Prompt Reference
Create an interactive teaching graphic of a quadratic function graph. Include a parabola showing the vertex coordinates, axis of symmetry, and intersection points with the x-axis (zeros). Use parameter sliders (a, b, c) to control quadratic coefficients and observe real-time graph changes. Draw vectors from the origin to the vertex, from the vertex perpendicular to the axis of symmetry, and from a point on the axis to a point on the curve. Create a triangle connecting the vertex, a point on the axis, and a point on the curve to demonstrate coordinate relationships. Use rotated text to label key point coordinates and segment lengths. The graphic should illustrate the standard form of quadratic functions, graph transformations, discriminant and root relationships, and the geometric meaning of slope (average rate of change) between two points on the curve.
The prompt above was compiled from the original drawing commands and is for reference only.