
Quadratic Function Graph Fitting
Loading the math board and drawing, please wait…
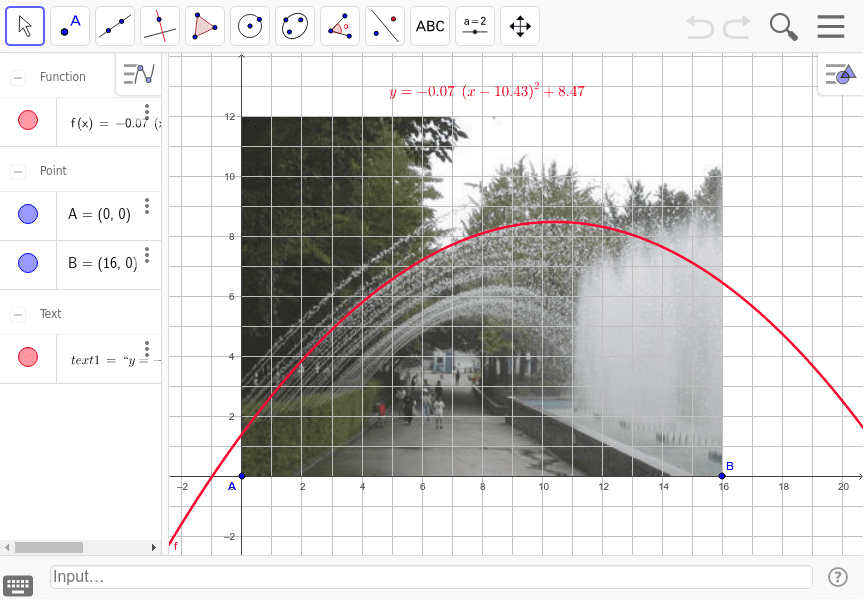
This example demonstrates how to fit a quadratic function graph in an image either by manual adjustment or using the FitPoly[] command. It involves core math concepts like quadratic functions, function graph fitting, and coordinate geometry. Key GeoGebra commands/objects used include A, B, pic1, f, text1. Suitable for high school mathematics teaching or student exploration of function graph properties.
GeoGebra Commands & Parameters
Point A(0.0, 0.0)Point B(16.0, 0.0)f(x) = -0.065 * (x - 10.43)^(2) + 8.47