
Quadratic Equations: Adjusting Parameters to Change Equations
Loading the math board and drawing, please wait…
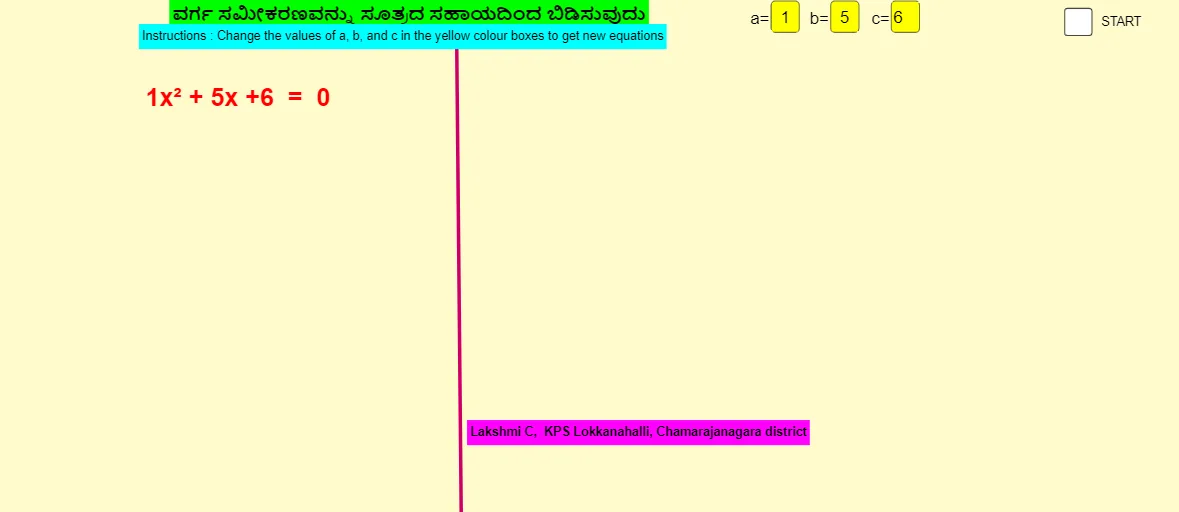
This example demonstrates how to change quadratic equations by adjusting numbers in yellow boxes. Key mathematical concepts include solving quadratic equations, relationships between coefficients and graphs. Construction involves GeoGebra commands like Textfield and Segment. Suitable for middle or high school math learning to understand basic properties of quadratic functions and graph transformations.
GeoGebra Commands & Parameters
Textfield(a_1) → InputBox1_1Textfield(b_1) → InputBox2_1Textfield(c_1) → InputBox3_1Segment(I, J) → i
AI Drawing Prompt Reference
Create an interactive math illustration showing a quadratic function graph. Display a parabola on a coordinate plane, with its equation controlled by three yellow input boxes for the quadratic coefficient, linear coefficient, and constant term. Place these boxes near the graph, each labeled with its parameter symbol. Include a horizontal reference segment on the canvas to help observe how the parabola shifts, stretches, or flips when the parameters change. The layout should be clean and educational, suitable for demonstrating function transformations in middle or high school.
The prompt above was compiled from the original drawing commands and is for reference only.