
Quadratic Equation Graphing Practice
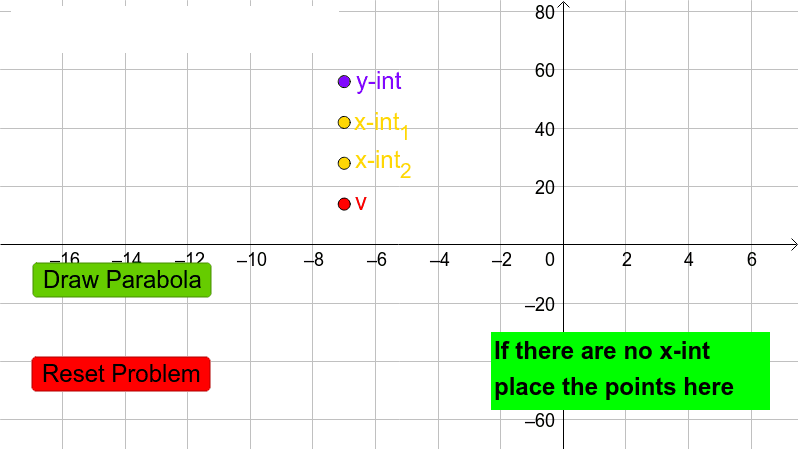
Loading the math board and drawing, please wait…
This example demonstrates the graphing of quadratic equations and analysis of their properties. Key mathematical concepts include quadratic equations, parabolas, vertex coordinates, and discriminant. Construction involves using GeoGebra commands such as Coefficients, Textfield, If to create equations, input parameters, calculate discriminant and vertex coordinates. Suitable for high school students or learners practicing quadratic equation graphing and understanding parabola properties.
GeoGebra Commands & Parameters
Coefficients(f) → CoeffTextfield(f) → InputBox1If(disc ≥ 0, h + sqrt(disc) / ((2 * Coeff(1))), 1) → x1If(disc ≥ 0, h - sqrt(disc) / ((2 * Coeff(1))), 1) → x2
AI Drawing Prompt Reference
Draw the graph of a quadratic function, accompanied by an input box for adjusting its equation. Based on the discriminant, mark the two x-intercepts of the parabola when the discriminant is non-negative, with their x-coordinates computed as the vertex's x-coordinate plus or minus the square root of the discriminant divided by twice the leading coefficient. If the discriminant is negative, display placeholder values of 1. The scene shows the function curve, the parameter input area, and the intercept labels for practice.
The prompt above was compiled from the original drawing commands and is for reference only.