
Propagation of Error in Sum and Multiplication: Numerical and Graphical Explorat
Loading the math board and drawing, please wait…
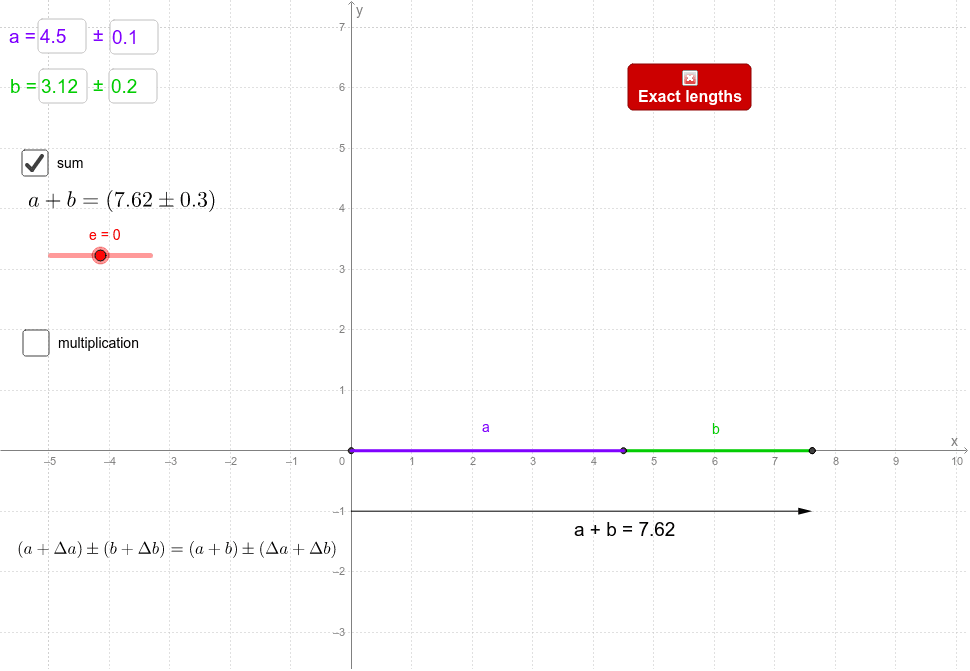
① This interactive GeoGebra example demonstrates how uncertainties (Δa and Δb) in two measured quantities (a and b) propagate through addition (a+b) and multiplication (a×b), using both numerical outputs and dynamic graphical representations. ② Core mathematical concepts include error propagation formulas, uncertainty analysis, linear approximation, and visual representation of error ranges, supported by auxiliary elements such as trapezoids, straight lines, 3D vectors, and histograms. ③ Construction highlights: Textfield commands create input boxes (campoInserimento1-4) for entering a, Δa, b, Δb; geometric objects (points A, B; segments c, d; vector u; polygon poli1; etc.) are built using Intersect, Segment, Vector, Polygon, and OrthogonalLine commands; text objects (testo1-3) display computed results, combining numerical and graphical feedback for intuitive observation. ④ Suitable for high school to university-level courses in physics, mathematics, or engineering measurement, this example helps learners grasp error propagation principles and serves as a teaching demo or self-guided exploration tool.
GeoGebra Commands & Parameters
Textfield(a) → campoInserimento1Textfield(b) → campoInserimento2Textfield(Δa) → campoInserimento3Textfield(Δb) → campoInserimento4Intersect(xAxis, yAxis) → ASegment(A, B) → cSegment(B, C) → dSegment(C, D) → fSegment(A, D) → gVector(F, E) → uSegment(A, (0, b)) → iSegment(B, H) → jSegment(G, H) → kPolygon(A, B, H, G) → poli1, a_1, b_1, h_1, g_1OrthogonalLine(J, xAxis) → nOrthogonalLine(I, yAxis) → pIntersect(n, p) → KPolygon(A, J, K, I) → poli2, a_2, j_1, k_1, i_1
AI Drawing Prompt Reference
Create a layout with four input fields for entering two values a and b, and their errors Δa and Δb. Then, plot points A and B on the coordinate system and draw line segments c, d, f, and g connecting these points. Next, draw vector u from point F to point E. Then, draw line segments i from point A to the y-axis at b, j from point B to the x-axis at b, k from point G to the x-axis at b, and trapezoid poli1 formed by points A, B, H, and G. Finally, draw perpendicular lines n and p to the x-axis and y-axis, respectively, which intersect at point K, and then draw trapezoid poli2 formed by points A, J, K, and I.
The prompt above was compiled from the original drawing commands and is for reference only.