
Proof of Time Vector and Hypothesis
Loading the math board and drawing, please wait…
In collections
Complex Math
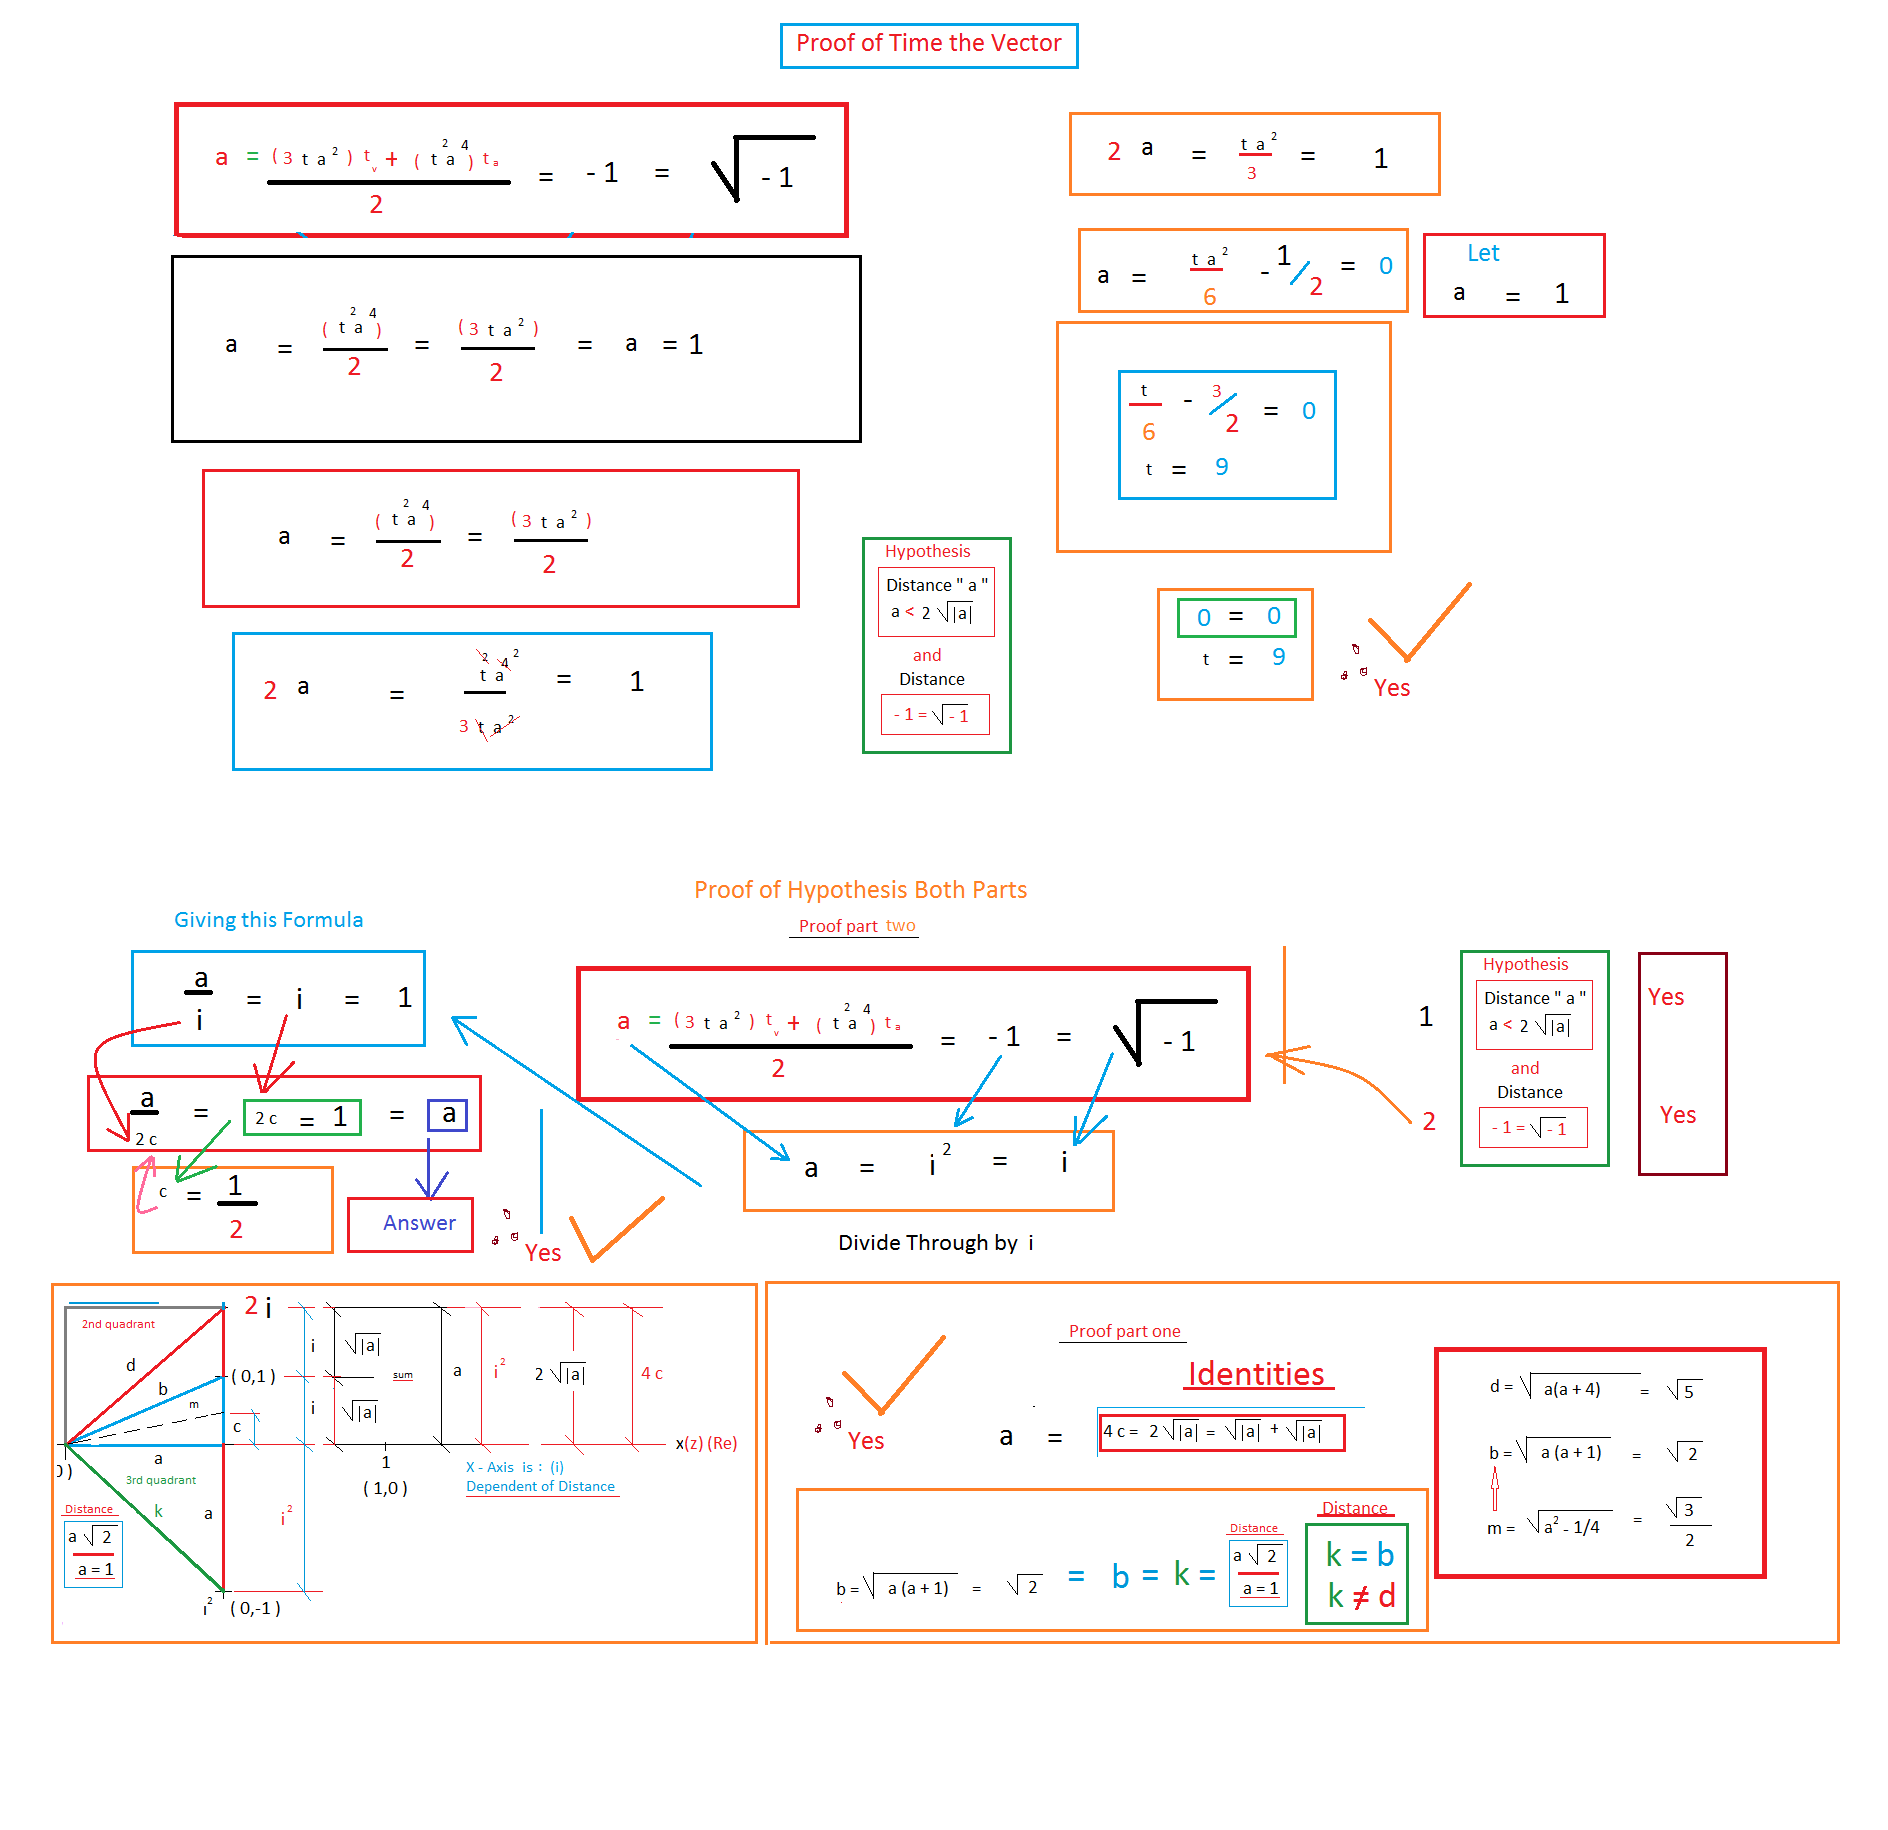
This example demonstrates the graphical and mathematical proof of the Time Vector and Hypothesis, involving core concepts like coordinate geometry, vectors, trigonometry, and statistics. It is constructed using GeoGebra objects A, B, and pic1, making it suitable for high school and above mathematics learners/researchers.
GeoGebra Commands & Parameters
Point A(-4.964, -27.336)Point B(30.522, -27.424)
AI Drawing Prompt Reference
Draw a coordinate system and mark two points on it, one at (-4.964, -27.336) and the other at (30.522, -27.424), to demonstrate their positions in the coordinate plane.
The prompt above was compiled from the original drawing commands and is for reference only.