
Probability Worksheet: Visualizing Geometric Events and Combinatorics
Loading the math board and drawing, please wait…
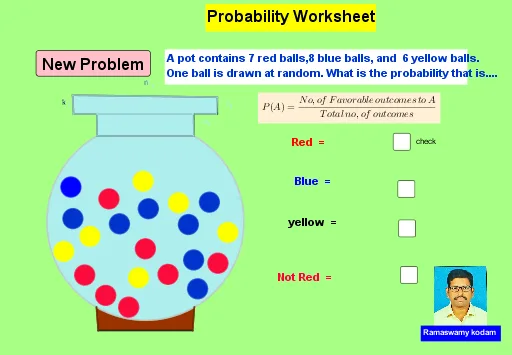
This example uses dynamic geometry to visualize how random events are partitioned and how their boundaries relate to probability or counting. It highlights core ideas from Probability & Statistics and combinatorics by mapping event relationships (such as intersection/containment) to clearly defined geometric regions. The construction leverages GeoGebra commands and objects from the provided summary: Point and Random to generate key points and stochastic choices; Intersect to compute intersection points that determine event borders; Circle and CircleArc to build circular regions and arcs; Line and Segment to form boundary lines and auxiliary segments; Mirror to create symmetric layouts and mirrored event structures; and Polygon to organize region outlines or partitions. Suitable for middle school to early college learners, especially for lessons and worksheets that connect geometric constructions with probabilistic reasoning and event counting.
GeoGebra Commands & Parameters
Point(yAxis) → ARandom(0, 8) → vRandom(0, 8) → bRandom(0, 8) → rIntersect(xAxis, yAxis) → BCircle(A, B) → c_3Point(c_3) → CMirror(C, yAxis) → C'Point(c_3) → DMirror(D, yAxis) → D'Segment(D, D') → fMirror(E, yAxis) → E'Segment(E, E') → gSegment(E', D') → hSegment(E, D) → iLine(E, E') → jPoint(j) → FMirror(F, yAxis) → F'Segment(G, F) → kSegment(F, E) → lSegment(E', F') → mSegment(H, G) → nSegment(H, F') → pCircleArc(A, D, D') → d_3Point(d_3) → IMirror(I, yAxis) → I'Mirror(J, yAxis) → J'Segment(I, J) → qSegment(J, J') → r_3Segment(I', J') → sCircle(K, 0.2) → eCircle(M, 0.2) → c_1Circle(N, 0.2) → d_1Circle(O, 0.2) → e_1Circle(P, 0.2) → f_1Circle(Q, 0.2) → g_1Point(yAxis) → RCircle(R, 0.2) → h_1Circle(S, 0.2) → k_1Circle(T, 0.2) → p_1Circle(U, 0.2) → q_1Circle(A_1, 0.2) → r_1Circle(W, 0.2) → s_1Circle(Z, 0.2) → t_1Circle(V, 0.2) → c_2Circle(B_1, 0.2) → d_2Circle(C_1, 0.2) → e_2Circle(I_1, 0.2) → f_2Circle(E_1, 0.2) → g_2Circle(H_1, 0.2) → h_2Circle(G_1, 0.2) → k_2Circle(F_1, 0.2) → p_2Circle(J_1, 0.2) → q_2Circle(D_1, 0.2) → r_2Intersect(j, k) → K_1Point(m) → L_1Intersect(n, p) → M_1Intersect(k, n) → N_1Polygon(K_1, L_1, M_1, N_1) → q1, i_1, l_1, m_1, n_1Point(g) → O_1Intersect(d_3, f, 1) → P_1Intersect(d_3, f, 2) → Q_1Point(g) → R_1Polygon(O_1, P_1, Q_1, R_1) → q2, o_1, j_1, a_1, i_2Intersect(d_3, q, 1) → S_1Intersect(q, r_3) → T_1Intersect(r_3, s) → U_1Intersect(d_3, s, 1) → V_1Polygon(S_1, T_1, U_1, V_1) → q3, j_2, l_2, u_1, v_1Circle(A_2, 0.2) → s_2
AI Drawing Prompt Reference
Draw a circle centered on the y-axis and randomly select four points C, D, E, and F on the circle. Then mirror these points across the y-axis to get C', D', E', and F'. Use these points to construct a series of segments and arcs, forming geometric regions. Finally, place some small circles randomly inside the circle to represent random choices for events or probabilities.
The prompt above was compiled from the original drawing commands and is for reference only.