
Probability Venn Diagram: Rectangle
Loading the math board and drawing, please wait…
In collections
Probability Venn Diagrams
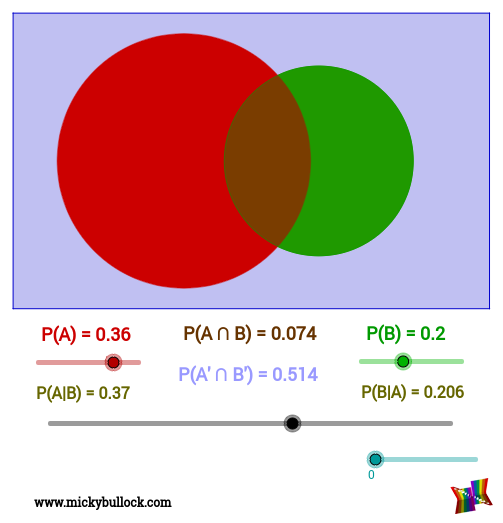
This example demonstrates how to represent a probability Venn diagram using a rectangle with proportionally-sized regions. Key math concepts include probability theory, set theory, and area calculations of geometric figures. GeoGebra commands and objects used in construction are Line, Circle, Segment, If, Midpoint, Polygon. Suitable for high school and above students learning about set relationships and area representation in probability statistics.
GeoGebra Commands & Parameters
Line(A, B) → cCircle(C, r1) → gCircle(D, r2) → eSegment(C, D) → distIf(x(D) - x(C) ≤ r1 - r2, Min[a, b], r1^(2) * θ + r2^(2) * α - h * ((r1^(2) - h^(2))^(0.5) + (r2^(2) - h^(2))^(0.5))) → intersection1If(x(D) - x(C) ≤ r2 - r1, Min[a, b], r1^(2) * θ + r2^(2) * α - h * ((r1^(2) - h^(2))^(0.5) + (r2^(2) - h^(2))^(0.5))) → intersection2If(r2 + r1 < x(D) - x(C), 0, If[r2 ≥ r1, intersection2, intersection1]) → IntersectAreaMidpoint(C, D) → EPolygon((x(E) - φ^(0.5) / 2, y(E) - 1 / (2 * φ^(0.5))), (x(E) - φ^(0.5) / 2, y(E) + 1 / (2 * φ^(0.5))), (x(E) + φ^(0.5) / 2, y(E) + 1 / (2 * φ^(0.5))), (x(E) + φ^(0.5) / 2, y(E) - 1 / (2 * φ^(0.5)))) → poly1, f, i, j, kCircle(D, r2) → pPolygon(F, G, H, I) → poly2, f_1, g_1, h_1, i_1If(logooff < 4.5, 0, 2 * (logooff - 4.5)) → logooffopa