
Probability Trees
Loading the math board and drawing, please wait…
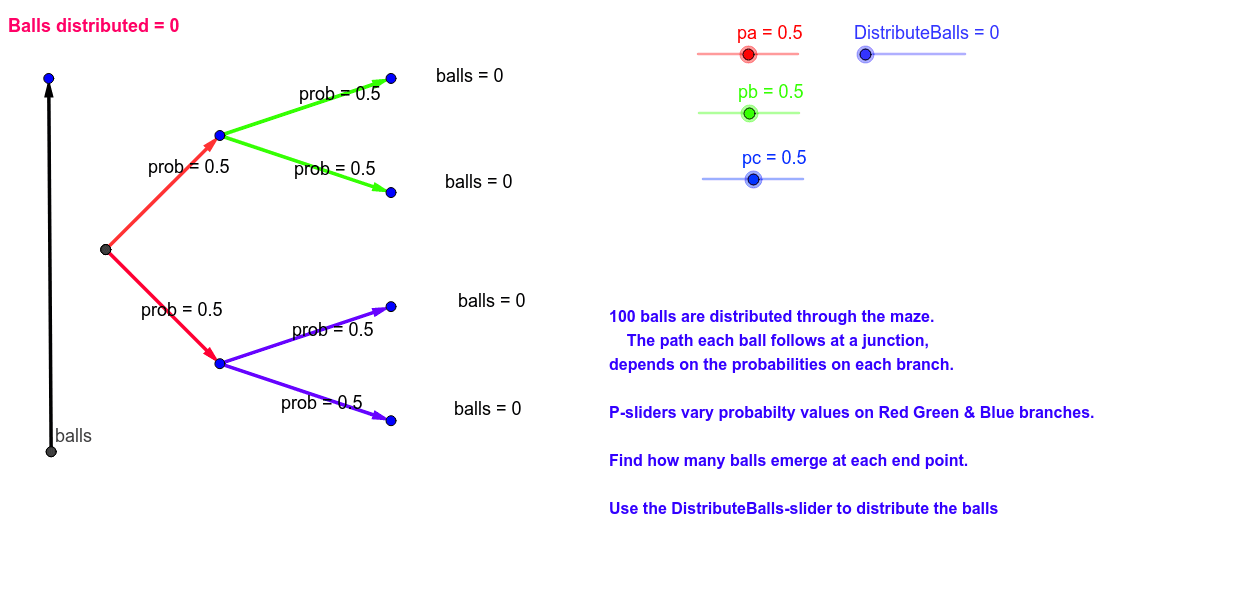
This example demonstrates a tree diagram with adjustable branch probabilities, illustrating probability propagation and accumulation. Core math concepts include probability theory, tree diagrams, set theory, and fractions. Construction highlights the use of GeoGebra commands like Intersect and Vector, with objects such as A to z and b1 to b4, and the DistributeBalls command to simulate ball flow. Suitable for high school students learning probability & statistics, ideal for interactive demonstrations and explorations.
GeoGebra Commands & Parameters
Intersect(yAxis, xAxis) → AVector(A, B) → uVector(A, C) → vVector(B, D) → wVector(B, E) → zVector(C, F) → aVector(C, G) → bVector(H, I) → c
AI Drawing Prompt Reference
Draw a probability tree with four main branches, each having two sub-branches. Start from the intersection of the x-axis and y-axis, and use vectors to connect the branch points, allowing the probability of each branch to be adjustable.
The prompt above was compiled from the original drawing commands and is for reference only.