
Probability Style Bar Chart
Loading the math board and drawing, please wait…
In collections
Learn GeoGebra Classic
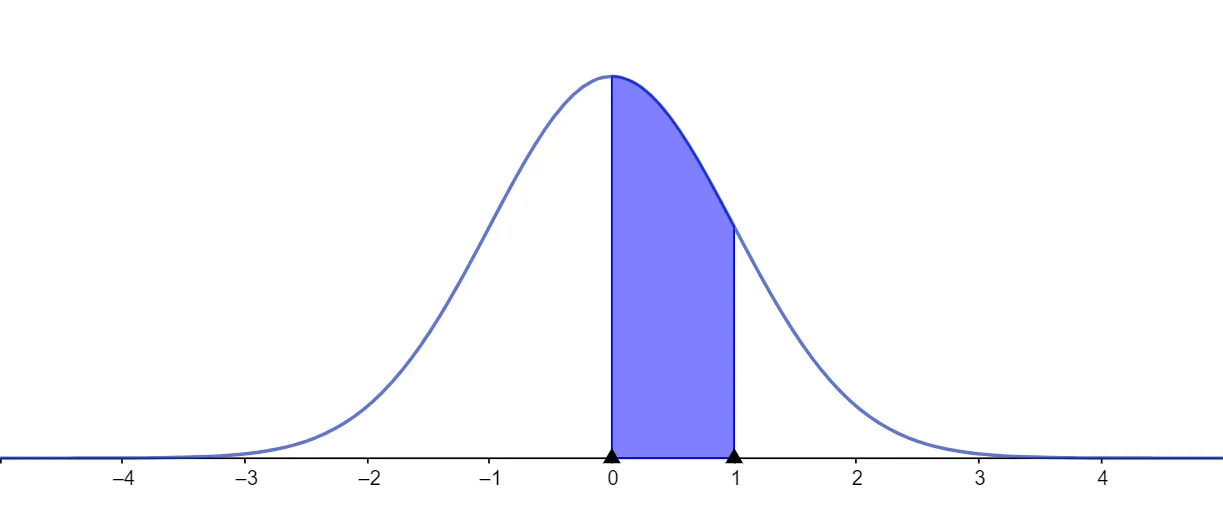
This example demonstrates how to use the Style Bar of the Distribution Calculator. By adjusting parameters, it provides a clear understanding of probability distributions. Core mathematical concepts include probability and statistics. The construction involves using GeoGebra's Distribution Calculator feature to display different probability distribution bar charts by adjusting parameters. Suitable for high school and above students or teachers to understand the basic principles of probability distributions.
AI Drawing Prompt Reference
Create a probability-themed bar chart to show different probability distributions with varying parameters. Start by setting the distribution type, such as normal or binomial, then adjust parameters like mean, variance, or success probability to observe changes in the bar chart and understand the basic principles of probability distributions.
The prompt above was compiled from the original drawing commands and is for reference only.