
Probability Spinner: Interactive Probability Simulation and Statistics
Loading the math board and drawing, please wait…
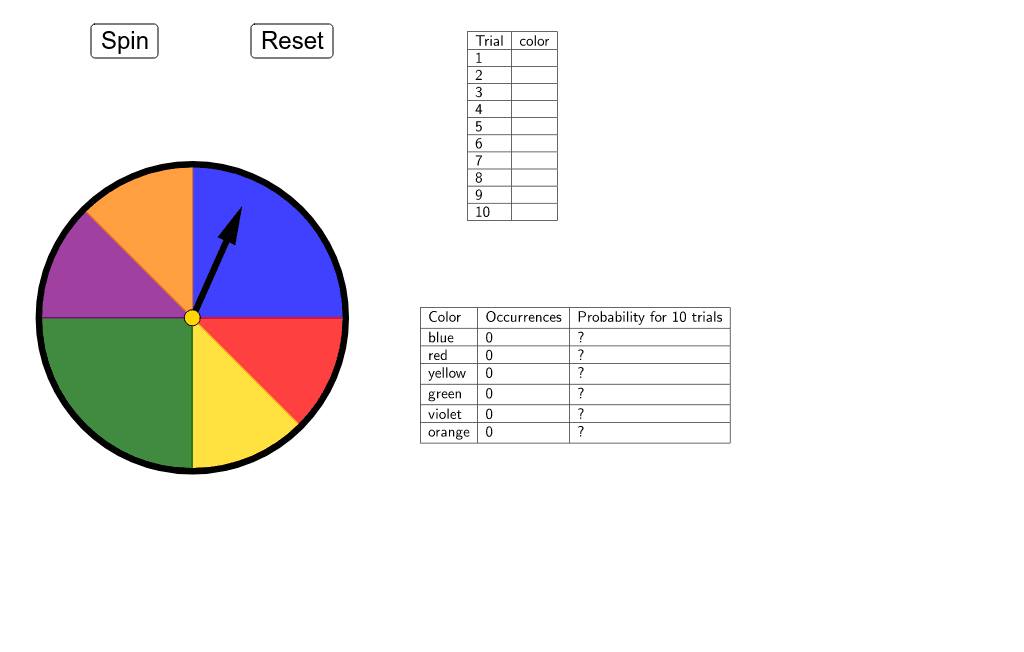
This GeoGebra example features an interactive circular spinner that simulates random events, visually demonstrating core concepts in probability and statistics, including probability distributions, binomial distribution, and the relationship between relative frequency and theoretical probability. The construction uses commands such as Circle, CircleSector, and Rotate to draw the spinner sectors, while CountIf, Sum, and Element are employed to tally outcomes in each region, with TableText generating a data table. Interactive buttons and sliders allow users to spin and observe results. Suitable for middle school through university students learning probability, and for teachers demonstrating random experiments and the law of large numbers in class.
GeoGebra Commands & Parameters
CountIf(x ≟ "orange", B2:B11) → E7CountIf(x ≟ "violet", B2:B11) → E6CountIf(x ≟ "green", B2:B11) → E5CountIf(x ≟ "yellow", B2:B11) → E4CountIf(x ≟ "red", B2:B11) → E3CountIf(x ≟ "blue", B2:B11) → E2Circle(A, B) → cRotate(S0, ((-a))°, A) → CVector(A, C) → uLine(B, A) → bOrthogonalLine(A, b) → eIntersect(c, e) → D, ECircleSector(A, E, B) → fIntersect(c, b) → F, GMidpoint(G, E) → HLine(A, H) → gIntersect(c, g) → I, JCircleSector(A, J, E) → hCircleSector(A, G, J) → kCircleSector(A, D, G) → pCircleSector(A, I, D) → qCircleSector(A, B, I) → rIsInRegion(C, f) → iIsInRegion(C, h) → jSum(Sequence[(IsInRegion[C, Element[liste2, k]] * k), k, 1, 6]) → mElement(liste1, m) → texte1TableText({{A1, B1}, {A2, B2}, {A3, B3}, {A4, B4}, {A5, B5}, {A6, B6}, {A7, B7}, {A8, B8}, {A9, B9}, {A10, B10}, {A11, B11}}, "|_") → text1TableText({{D1, E1, F1}, {D2, E2, F2}, {D3, E3, F3}, {D4, E4, F4}, {D5, E5, F5}, {D6, E6, F6}, {D7, E7, F7}}, "|_") → text2
AI Drawing Prompt Reference
Draw a circular spinner with a central pivot point, divided into six equal colored sectors by radial lines, colored blue, red, yellow, green, violet, and orange in order. A pointer extends from the center to the edge and can rotate around the center. Below the spinner, display a data table recording the number of times the pointer lands in each color after multiple spins, with frequency counts for each sector. The overall layout has the spinner on top and the table below, simulating a probability experiment.
The prompt above was compiled from the original drawing commands and is for reference only.