
Four Blues and Four Reds: Interactive Probability and Geometric Transformation
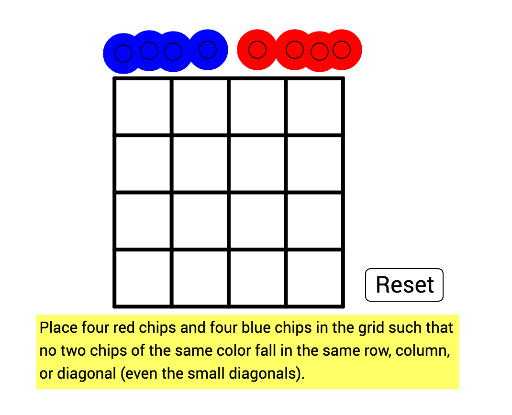
Loading the math board and drawing, please wait…
① This example demonstrates a geometric construction featuring four blue and four red points, likely illustrating probability, percentages, and geometric transformations in an interactive way. ② Core math concepts include probability and statistics (e.g., event percentages), exponents (possibly for growth/decay), geometric transformations (translations, rotations, or reflections), and basic geometry (circles, segments, points). ③ Construction details: Based on the summary, GeoGebra commands such as Segment, Point, and Circle are used, creating multiple objects (points A through W, segments/circles f through s). The arrangement of blue and red points may be generated via intersections of circles or dynamic sliders, allowing users to explore changes in color distribution or symmetry. ④ Suitable for middle and high school students, this example serves as a visual tool for teaching probability combined with geometry, exploring how transformations affect spatial arrangements, or as a logic puzzle for pattern recognition.
GeoGebra Commands & Parameters
Segment(A, B) → fSegment(C, D) → gSegment(E, F) → hSegment(G, H) → iSegment(I, J) → jSegment(A, I) → kPoint(f) → KPoint(j) → LSegment(K, L) → lPoint(f) → MPoint(j) → NSegment(M, N) → mPoint(f) → OPoint(j) → PSegment(O, P) → nSegment(B, J) → pCircle(Q, a) → cCircle(R, a) → dCircle(S, a) → eCircle(T, a) → qCircle(U, a) → rCircle(V, a) → sCircle(W, a) → tCircle(Z, a) → c_1