
Various Volumes
Loading the math board and drawing, please wait…
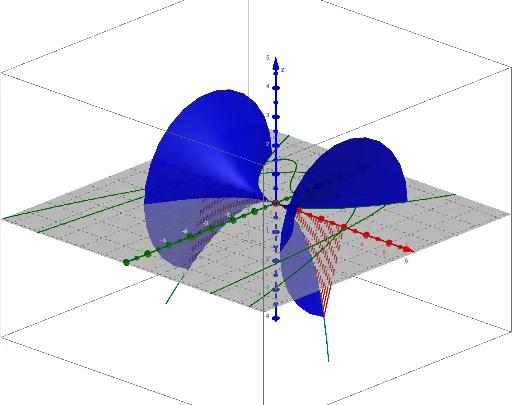
This example demonstrates the calculation and visualization of volumes of different geometric solids. It involves core mathematical concepts such as volume formulas, probability, conditional probability, geometric terms, plane figures, and similar triangles. The construction highlights the use of GeoGebra commands/objects like SelectedElement, CurveCartesian, Surface, Sequence, parameters α and d, min and max, lists list2 and list1, and buttons button1 and button2. It is suitable for high school students and mathematics enthusiasts exploring geometric volumes and probability statistics.
GeoGebra Commands & Parameters
SelectedElement(list2) → fCurveCartesian(a, (f(a) * cos(α)), (f(a) * sin(α)), a, -5, 5) → aaSurface(a, (f(a) * cos(β)), (f(a) * sin(β)), a, min, max, β, 0, α) → bSequence(Segment[(a, 0, 0), (a, (f(a) * cos(α)), (f(a) * sin(α)))], a, min, max, d) → list1
AI Drawing Prompt Reference
Create a 3D solid generated by rotating a curve defined by a selected element from a list, using polar coordinates to form a surface of revolution. The figure shows multiple geometric solids with varying volumes, including a series of line segments evenly spaced along the rotation axis, connecting points on the axis to corresponding points on the surface. The overall shape is a rotational body in three-dimensional space, with parameters controlling the rotation angle and range, suitable for illustrating volume calculations and probability statistics.
The prompt above was compiled from the original drawing commands and is for reference only.