
Probability Marbles APS
Loading the math board and drawing, please wait…
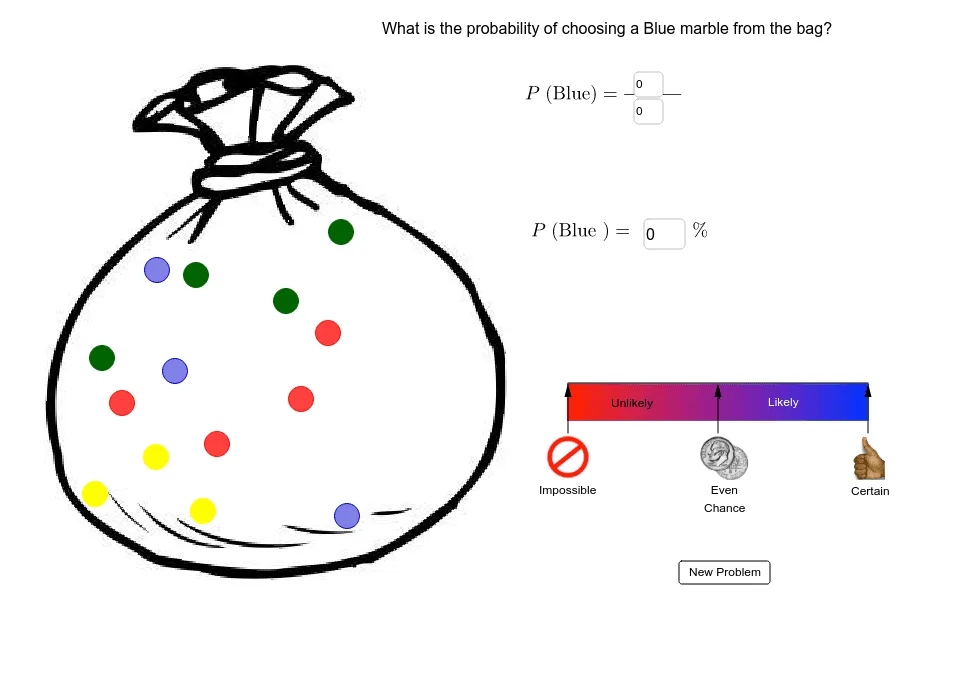
This example demonstrates the graphical simulation of marble distribution and conditional probability in probability statistics. Core math concepts include probability, conditional probability, midpoint, and vector. Construction highlights the use of GeoGebra commands like Circle, Element, Textfield, Segment, Midpoint, and Vector. Suitable for high school students and math enthusiasts for teaching and exploration in probability statistics.
GeoGebra Commands & Parameters
Circle(G, 0.25) → gCircle(H, 0.25) → hCircle(I, 0.25) → kCircle(J, 0.25) → pCircle(K, 0.25) → qCircle(L, 0.25) → rCircle(M, 0.25) → sCircle(N, 0.25) → tCircle(O, 0.25) → c_1Circle(P, 0.25) → d_1Circle(Q, 0.25) → e_1Circle(R, 0.25) → f_1Circle(S, 0.25) → g_1Circle(T, 0.25) → h_1Circle(U, 0.25) → k_1Circle(V, 0.25) → p_1Circle(W, 0.25) → q_1Circle(Z, 0.25) → r_1Circle(A_1, 0.25) → s_1Circle(B_1, 0.25) → t_1Circle(C_1, 0.25) → c_2Circle(D_1, 0.25) → d_2Circle(E_1, 0.25) → e_2Circle(F_1, 0.25) → f_2Circle(G_1, 0.25) → g_2Circle(H_1, 0.25) → h_2Element(Color, Choose) → text1Textfield(a) → InputBox1Textfield(b) → InputBox2Textfield(Percentage) → InputBox3Circle(G_2, 0.25) → g_3Circle(G_3, 0.25) → g_4Circle(G_4, 0.25) → g_5Circle(G_5, 0.25) → g_6Segment(I_1, J_1) → iMidpoint(i) → K_1Vector(L_1, I_1) → uVector(M_1, K_1) → vVector(N_1, J_1) → wVector(Z_1, W_1) → j
AI Drawing Prompt Reference
Create an educational diagram for probability statistics: scatter many small circles of equal size across the canvas, representing marbles of different colors. Include three input boxes for entering a number, a ratio, and a percentage, with a text label nearby showing the currently selected color. Below or beside the main area, draw a line segment connecting two key points, mark its midpoint, and from the midpoint and the two endpoints, draw three arrow vectors pointing in different directions to illustrate transitions or event paths in conditional probability. Keep the layout clear, emphasizing the visual link between marble distribution and probability calculations.
The prompt above was compiled from the original drawing commands and is for reference only.