
Probability Distribution Tool
Loading the math board and drawing, please wait…
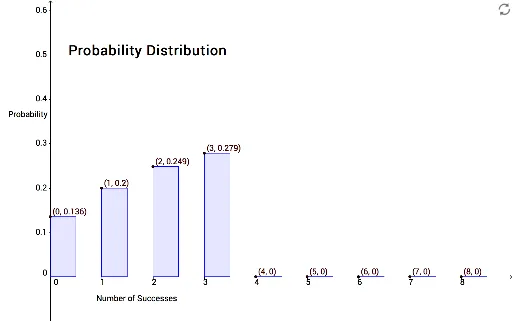
This example demonstrates the graphical representation of probability distributions, particularly the normal distribution curve and its impact on parameter changes; core math concepts include probability & statistics, parametric curves, linear equations, and normal distribution; construction highlights the use of GeoGebra commands like Point and Polygon, along with multiple objects (A, B, f, g, h, i, j, k, l, m, C, D, E, F, G, H, I, J, K, L, M, N, O, P, Q, R, S, T, U, V, W, Z, A_1, B_1, C_1, D_1, E_1, F_1, G_1); suitable for high school and above students learning probability statistics and data analysis, or university foundational teaching.
GeoGebra Commands & Parameters
Point(yAxis) → BPoint(f) → CPoint(g) → DPoint(h) → EPoint(i) → FPoint(j) → GPoint(k) → HPoint(l) → IPoint(m) → JPolygon(B, A, S, T) → poly1, b, a, s, tPolygon(C, K, U, V) → poly2, c, k_1, u, vPolygon(D, L, W, Z) → poly3, d, l_1, w, z_1Polygon(E, M, A_1, B_1) → poly4, e, m_1, a_1, b_1Polygon(F, N, C_1, D_1) → poly5, f_1, n, c_1, d_1Polygon(G, O, E_1, F_1) → poly6, g_1, o, e_1, f_2Polygon(H, P, G_1, H_1) → poly7, h_1, p, g_2, h_2Polygon(I, Q, I_1, J_1) → poly8, i_1, q, i_2, j_1Polygon(J, R, K_1, L_1) → poly9, j_2, r, k_2, l_2
AI Drawing Prompt Reference
Draw a graph showing the probability distribution, particularly the normal distribution curve, with sliders to demonstrate the impact of parameter changes. Include multiple points connected to form several polygons, creating a complex geometric structure that visually represents core concepts in probability, statistics, and data analysis.
The prompt above was compiled from the original drawing commands and is for reference only.