
Probability Distribution on the Unit Circle
Loading the math board and drawing, please wait…
In collections
Mapping Diagrams: From AB to C&DE, Resource
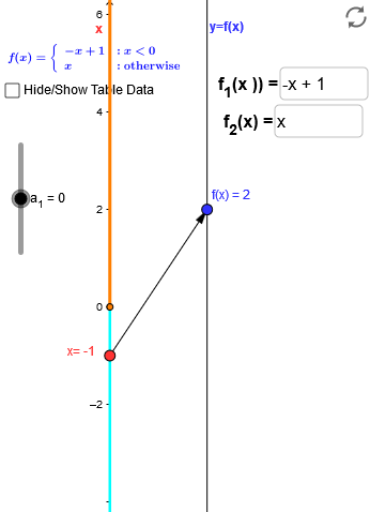
This example demonstrates probability distribution on the unit circle. Key mathematical concepts include probability, distributions, and stochastic processes. Using GeoGebra commands such as Point, Vector, Sequence, etc., it constructs multiple points and vectors to show the dynamic changes in probability distribution. Suitable for high school mathematics education and learning.
GeoGebra Commands & Parameters
Point(yAxis) → A_1Vector(A_1, B) → uSequence((k, f(k)), k, -3, 3, 0.5) → list2Sequence(Vector[(0, k), (2, f(k))], k, -3, 3, 0.5) → list1Segment((0, -5), (0, a_1)) → cSegment((0, a_1), (0, a_2)) → dTextfield(f_1) → inputBox1Textfield(f_2) → inputBox2Textfield(f_3) → inputBox3Textfield(f_1) → inputBox4Textfield(f_2) → inputBox5