
Geometric Matching to Data: Construction and Testing
Loading the math board and drawing, please wait…
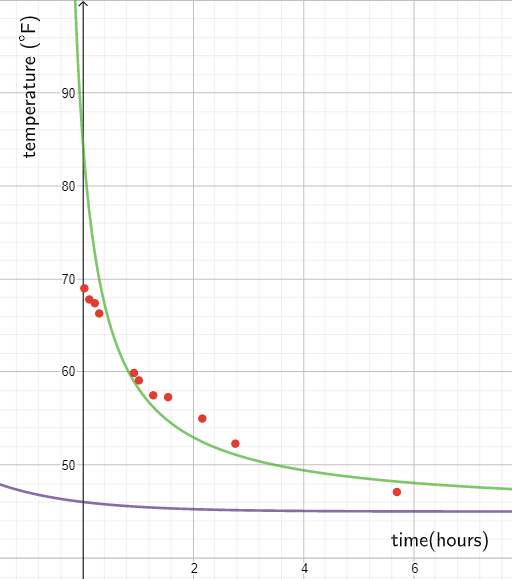
This example demonstrates how to match geometric objects to given data by building an interactive construction and then checking consistency using logical conditions and inequality-style constraints. It centers on the relationships behind an incircle/inscribed-circle characterization, the use of functions or rule-based objects (f, g) to encode constraints, and the interpretation of match quality through conditions rather than a single static picture. Construction-wise, the diagram uses text labels (text1, text2) to guide steps and conclusions, many labeled points (A1–A12, B3–B12) to represent sampled features or target locations, additional auxiliary points (D2–D12), and a parameter/variable (a) to drive the matching logic. The setup also supports a vector/3D viewpoint when defining relationships among points. Suitable for secondary school advanced geometry through early undergraduate geometry/interactive mathematics, especially for lessons on geometric construction, verification, and data-to-model thinking.
GeoGebra Commands & Parameters
f(h) = 45 + 20 / (h + 0.5)g(h) = 45 + (33 * 0.5^(h + 05))0.03690.120.220.30.931.021.281.552.172.775.767.867.466.359.959.157.557.35552.347.1(A2, B2)(A3, B3)(A4, B4)(A5, B5)(A6, B6)(A7, B7)(A8, B8)(A9, B9)(A10, B10)(A11, B11)(A12, B12)Boolean a(true)Boolean b(true)Boolean c(true)Boolean d(true)Boolean e(true)Boolean h(true)Boolean i(true)Boolean j(false)Boolean k(true)Boolean l(false)Boolean m(true)
AI Drawing Prompt Reference
Draw a graph with 12 point pairs (A1-B1 to A12-B12), where each pair's position is defined by two functions: f(h) = 45 + 20 / (h + 0.5) and g(h) = 45 + (33 * 0.5^(h + 0.5)). Set a parameter a to true to control the matching logic of these point pairs. Adjust parameter a to observe how the point pairs change according to the variations of functions f and g.
The prompt above was compiled from the original drawing commands and is for reference only.